| |

| Build-Your-Own | Main Panel
| Dipole Woofer | Crossover/EQ
| Circuit Board |
| System Test | Design
Models | Prototypes
| Active Filters | Surround
| FAQ |
This page gives you measured frequency response data for
the PHOENIX system. I also added a few pointers for constructing a tone-burst signal source
and a receiver with microphone and fast peak meter for those of you, who would
like to build some versatile acoustic test equipment.
I must point out that steady-state frequency response
curves - magnitude and phase - present only a limited view of a loudspeaker. Hidden in
them, and often not discernible to the eye, are further linear distortion data.
These are better seen in shaped tone-burst measurements in the time domain.
Also, non-linear distortion, which adds its own signature via new spectral
components, that were not present in the original, must be made visible with
single and multi-tone test signals.
Stored energy and non-linear distortion measurements were
performed on a variety of drivers and influenced the selection made for the
PHOENIX. The 9800 tweeter exhibits increased decay times above 12 kHz due to the
trapped air between dome apex and plastic cup forming a mechanical spring-mass
system. Removing the cup rapidly rolls off the response (-8 dB at 20 kHz). The
D2905/9700 soft dome tweeter is, in these respects, a more accurate transducer
and can be readily substituted. Regardless, the metal dome tweeter was initially
chosen for this
design based on a slight listening preference. I have since gone back to the
9700 as the more accurate tweeter.
Frequency response must also be evaluated by how it might
generate resonances, reverberation and reflections in the playback
venue.
And finally, the eye and the ear do not respond in the same way. Often
too much, in terms of audible significance, is read into the wiggles of a graphical
presentation of the response from a single microphone to the sound pressure at a
single point in space. On the other hand, more subtle details and broad trends
are often overlooked. Our ear-brain system has its own value scale for sound
perception, one that has been honed over a few millennia by what is important
for the survival of the species.
With that precaution in mind, here is a limited set of
data describing the frequency response of the PHOENIX system.
Crossover / equalizer
The crossover/equalizer corrects for trends in the
frequency response. No attempt was made to deal with the remaining fine grain
structure in the response, which is primarily caused by diffraction effects.
Those were minimized by the shape of the main panel (FAQ8). The drivers were selected
for their inherent smooth frequency response, in addition to their low
distortion and volume displacement capability.
1 - Buffer output, woofer, midrange, and tweeter drive signal frequency response.
Woofer and tweeter level adjustments are set to midpoint (12:00 o'clock). x1.gif
Note 1 - If you
wanted to build the PHOENIX with passive crossovers, i.e. inductor, capacitor,
and resistor networks between power amplifier and driver terminals, then you
would have to replicate the above frequency response curves - magnitude and phase
(non-minimum!) - for the woofer, midrange and tweeter terminal voltages when
measured at the output of the corresponding filter network loaded by the driver.
This is not a trivial design task. Even if you came close with this part, there
would still be another difference, because of the impedance seen by the drivers.
In the active crossover/eq case each driver looks back into the very low output
impedance of the power amplifier. This provides voltage control over the voice
coil motion at all frequencies. In the passive case each driver sees the highly
frequency dependent output impedance of a filter network. At larger signal
levels, where driver non-linear distortion tends to set in, the passive and
active systems will have sonic differences due to the impedance differences
which affect the flow of distortion currents.
Note 2 - It would be
interesting to build the PHOENIX with current control of the drivers to
investigate further distortion reduction. I have observed that the
distortion products in the acoustic output spectrum of a driver are highly correlated with the
distortion components of its voice coil current waveform, when driven from a voltage
source. Using feedback it should be possible to linearize the voice coil current
and thereby reduce distortion to some degree. The driver frequency responses would have to be
re-measured under current drive conditions and the crossover/eq redesigned
accordingly.
2 - Crossover/eq frequency response curves as above but without 100-200 Hz shelving
high-pass filter and 2760 Hz
notch filter. x2.gif
Main panel
The main panel reproduces a frequency range of about 8
octaves, 4 by the midrange and 4 by the tweeter.
1 - The impedance seen by the midrange amplifier is
about 3.5 ohm and 4.5 ohm by the tweeter amplifier. The amplifiers selected must
be able to supply the required current without limiting and have a low output
impedance. Connecting the 8554's in series would have given a 14 ohm impedance
and would require large voltage swing capability from the amplifier, i.e. a high
power rating. p1.gif
2 - The following data were taken outdoors with the tweeter 108"
(2.74 m) above the ground and the microphone 52" (1.32 m) in front of the
tweeter to approach an echo free measurement setup.
In this first measurement the relative output of the drivers is seen. The
midranges are about 12 dB higher than the tweeter. The difference is easily
corrected with different gain settings in the active xo/eq channels.
For a passive crossover the midranges would have to be
connected in series to drop their output 6 dB. The remaining difference would
have to be dissipated and reflected by the passive xo.
The measured response curves are the result of driver
response, panel diffraction and proximity of drivers to each other. The
periodicity of about 1 kHz in the tweeter response is due to the panel
width. p2.gif
3 - The horizontal off-axis response of the midranges below 400 Hz shows the typical
dipole cos(angle) behavior, e.g. -3 dB at 45 degrees and -6 dB at 60 degrees.
Around
700 Hz dispersion widens due to the phase of the rear radiation having been
modified by the basket and rear cavity acoustic low-pass filter. It also causes the bump at
500 Hz and the roll-off at 6.9 dB/oct instead of 6 dB/oct. Above 2 kHz
dispersion narrows, but the drivers are not used in this frequency range. p3.gif
4 - Horizontal off-axis response of the tweeter on the panel. Widest
dispersion is at 4 kHz. It narrows above this frequency and shows response peaks
around 16 kHz. These are due to the cup in front of the dome.
Caution!! A measurement like this, without any high-pass
filter, can easily damage or destroy the tweeter and should be performed with
adequately low amplifier power. The only safe test signal is the shaped
tone-burst. It can actually be used at very high amplifier output voltage swings
to hear the onset of clipping distortion and to determine the maximum SPL
capability of a driver. p4.gif
5 - Response of the 1400 Hz crossover between midrange and tweeter using
the active xo/eq. There is about a two octave wide region of overlap between the
drivers where both contribute to the total sound output. p5.gif
6 - The off-axis response of the equalized main panel is dominated by the
midranges at the low end and the tweeter at the high end. Note that the
dispersion follows essentially dipole behavior up to 1400 Hz, then becomes wider
before finally narrowing above 6 kHz. p6.gif
7 - Effect of the 2760 notch filter upon the frequency response. p7.gif
8 - Horizontal off-axis response with the notch filter in place. p8.gif
9 - Off-axis response measured at a larger 86" (2.18 m) distance
from the tweeter shows smooth, well controlled behavior of the panel. p9.gif
10 - The vertical off-axis response above and below the tweeter axis is
dominated by the overlap region between midrange and tweeter and the relative
spacing of the three drivers to each other. The data was taken with the
microphone at 52" (1.32 m) in front of the panel and the panel being
lowered by 4.5", 9" and 14" to increase the angle from zero to 5,
10 and 15 degrees.
Note the relatively wide dispersion
of the system even in the vertical plane. Never-the-less, the tweeter height
should be at or slightly above the ear when seated. For psycho-acoustic reasons
that I do not fully understand, one can always tell when a speaker's acoustic
center is lower than ear height. Tilting back the speaker, as is done for some
products, will not correct that impression. We seem to use the floor reflection
even to localize a virtual image. It immediately sounds unrealistic to me when
the orchestra's sound comes from below. p10.gif
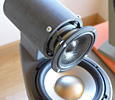
Dipole woofer
The woofer reproduces a frequency range of about 2
octaves.
1 - The impedance seen by the woofer amplifier is
greater than 6.5 ohm and includes the driver resonance in the cabinet. Some
expensive tube gear has difficulty driving such load. Only solid-state
amplifiers should be used. w1.gif
2 - The following data were all taken outdoors on a concrete floor.
First, the acoustic output at the front opening plane of the floor mounted cabinet. No
dipole diffraction effects are seen, because the microphone is too close to the
source.
The response follows what one would calculate (Ref.
12) from the impedance curve
for a closed box woofer with a -3 dB point at 13 Hz for Qts = 0.7. It is also
the response of the dipole woofer in the far-field, after the +6 dB/oct
equalization has been applied.
The 270 Hz
peak and the following dips and peaks are caused by the acoustic impedance
mismatch between the transmission line inside the cabinet and the front opening
into half-space. The effectiveness of the 290 Hz notch filter in attenuating the
first peak can be seen. w2.gif
3 - Response at the same location as above, but with 100 Hz crossover low-pass filter and +6 dB/oct dipole equalization applied. w3.gif
4 - The crossover between woofer and midrange as measured at a horizontal
distance of 96" (2.44 m) from the panel and with the microphone on the
ground. The tweeter height is 39" (0.99 m). The measurement is influenced
by reflections from nearby objects and by ambient noise as seen in the lower
traces. The SPL from the midranges is doubled at the ground plane relative to
free space. w4.gif
5 - When the microphone is raised to 39" the midrange output drops
about 6 dB on average, after smoothing out the floor reflection oscillations in
the response. By applying the 100-200 shelving high-pass filter the woofer and
midrange levels are gradually lowered relative to the midrange at higher
frequencies. If merely the woofer level was lowered by reducing its xo/eq gain
by 6 dB, then a step in the frequency response around 100 Hz would result,
because the transition from half-space to full-space sound propagation is too
abrupt. w5.gif
Microphone
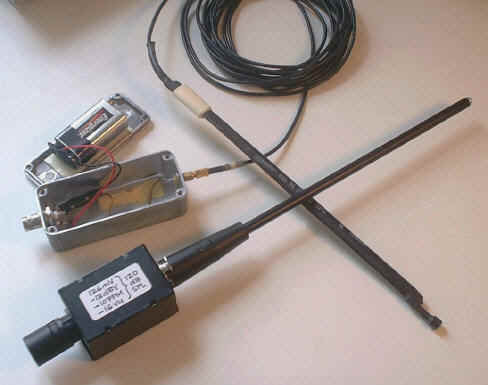
A high quality measurement and recording microphone with
flat frequency response can be
constructed using the Panasonic omni-directional back electret microphone
cartridge WM-60AY. Currently it is priced at
$23.41 for 10 units(!) under Digi-Key
part number P9959-ND.
When the cartridge is connected as described by Panasonic it produces fairly
high distortion at moderate SPL's and is marginally suitable for serious
recording and measurement purposes. The microphone itself is extremely linear,
but the built in FET amplifier stage is not configured optimally.
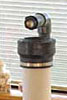
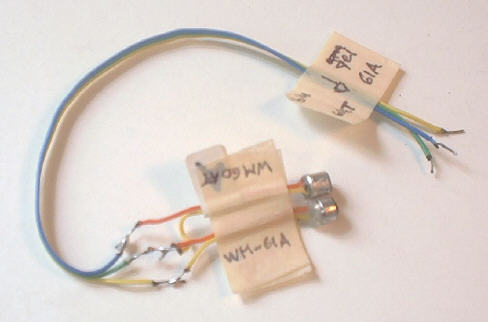
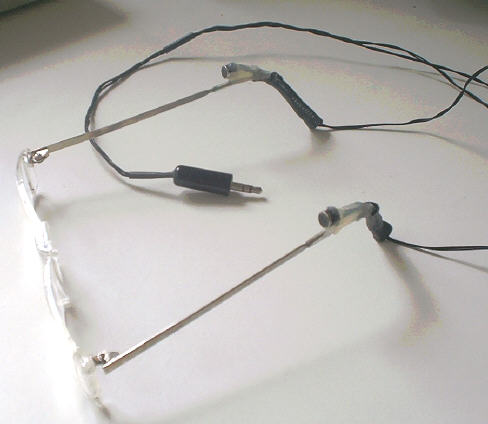
Fortunately, is it possible to modify the external
connection to the FET. This involves some delicate work of cutting a trace on the tiny pcb
in back of the cartridge and soldering thin, flexible wires to the standard two
hookup points, and making a different connection to the capsule housing. The pcb
has a circular ring of copper on its outside, which can be exposed by shaving
off a small section of the aluminum roll surround with a sharp blade. Then
solder a wire from the copper ring to the hookup point that was originally the
positive capsule terminal and make it the new ground wire. The terminal with the
cut trace becomes the new active output. You might sacrifice
some cartridges while learning the process. It is important not to overheat the
cartridge when soldering the wires to it, because it destroys the electret.
Also, after wires have been connected, the whole backside should be covered with
Silicone II Glue to avoid low frequency roll-off due to a broken air seal which
might have been caused by the modification. Heat shrink tubing can be used to
attach the capsule to a wooden dowel, or the capsules can be glued into the end
of a 1/4 inch ID thin metal pipe. Look at the microph1.gif
page from my notebook for further details.
The output voltage from the modified WM-60AY capsule can swing 5 Vpp (!) max at
141 dB SPL using a 9 V supply, and easily overload a preamplifier with too much
gain. Noise floor measures about 36 dB SPL, 80 Hz to 20 kHz, with a 1/f
corner around 100 Hz. A-weighted noise is estimated as 30 dB(A).
A more sensitive capsule with a few dB lower noise of 26 dB(A) is the WM-61A. It
outputs a maximum 5 Vpp at about 134 dB SPL.
I first learned about the microphone modification from Lyman Miller, Palo Alto, a
friend and former colleague at HP, who does some of the most natural sounding
recording I have heard.
The wiring diagram for a stereo microphone with output attenuator, if needed,
and using the modified capsules is shown on the microph2.gif
page. Attenuation of the microphone output degrades the signal to noise
ratio and should only be used, when the preamplifier gain can not be reduced.
A discussion of microphone issues can be found at the MicDIYers
forum.
Shaped tone-burst generator
The shaped tone-burst generator is a gating circuit which
counts off five cycles of an incoming sine wave and applies a cosine amplitude
envelope to them so that the output signal gradually builds up from zero level to a
peak and then decreases gradually back to zero. Since the number of cycles is
fixed, the signal occupies a constant percentage frequency bandwidth, in this
case about 1/3 octave, centered at the sine wave frequency. The duration of the
signal is long at low frequencies and becomes shorter as frequency
increases.
The signal is uniquely suited for speaker and room measurements, because when
observed on an oscilloscope, it shows both frequency and time domain aspects of
the system under test. Ref. 13. It is also
a safe test signal to explore maximum output capability of drivers and power
amplifiers.
A simple gating circuit which approximates the cosine envelope is shown in brst_gen.gif
(23KB). The specified IC components, though, need updating for current
availability. A project with this intent is underway at https://www.sound.au.com/project58.htm.
The circuit must be driven from a signal generator, for
example the Neutrik Minirator.
Burst and signal generator, together, form a very practical, portable test
signal source.
A more elegant solution for creating shaped tone bursts with all kinds of
envelopes and numbers of cycles would be the HP
33120A Arbitrary Waveform Generator in conjunction with the HP 34811A
BenchLink Software.
It is not too difficult, either, to program a CD-RW on a PC with a catalog of
bursts of different frequencies. The mathematical expression for a
5-cycle burst with cosine envelope is:
f(t) = [0.5 - 0.5*cos(w*t)]*sin(5*w*t)
where 0 < t < 1/f and w = 2*pi*f
The burst is repeated once every second. The burst frequency is stepped in 1/6
octave increments (1.1225*f), starting at 20 Hz.
For example, listen to a 1 kHz, 4-cycle
burst with Blackman
envelope, 1kblkman4.wav, which is optimized for time domain observation of the response decay. A
16000 point data file of the waveform is available as blkman_4.prn.
Point and amplitude values are separated by a tab. You can open the file in
Excel and create a graph. It should be possible to generate *.wav files of
different frequency from this.
A signal consisting of four bursts with cosine envelope over 10 cycles of a 100 Hz
sine-wave is useful for evaluating low frequency room acoustics, 100mbst4.wav.
The loss in audible articulation of the test signal modulation is a measure of
the masking due to room modes and other resonances excited by the speaker. Ref.1
& 13. A 16000 point data file of the waveform for a single 10 cycle
burst is available as cos_10.prn.
A CD with recorded
burst signals for room and speaker tests is available.
---------------------------------------------------------------
| Build-Your-Own | Main Panel
| Dipole Woofer | Crossover/EQ
| Circuit Board |
| System Test | Design
Models | Prototypes
| Active Filters | Surround
| FAQ |
|

