|
|
|
|
|
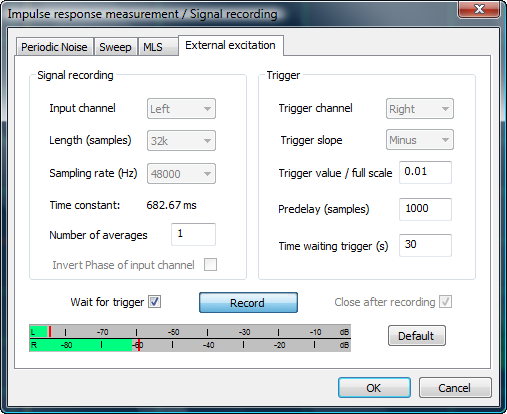
My test setup now consists
of the ARTA
software running on an HP Pavilion dv4-1120us Entertainment Notebook
PC with Vista 64bit OS. The E-MU USB 2.0 Tracker Pre Audio Interface/Mobile Preamp
has very low distortion and is a remarkably high value component for its
extensive features such as phantom powered microphone inputs.
The signal generator is made up of an HP 33120A Arbitrary Waveform Generator from 1994 and a Hafler DH-220 power amplifier from even longer time ago. The 33120A can generate user defined bursts of selectable count and rate. The bursts can be triggered manually. Thus a signal of defined shape, frequency, amplitude and duration can be applied to the driver under test. |
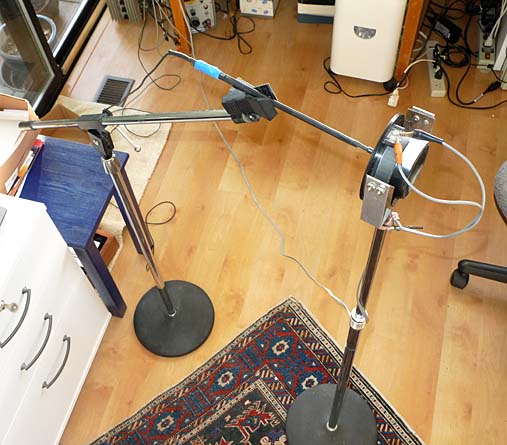 |
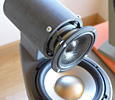
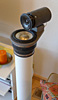
The microphone is a modified Panasonic
capsule, powered by a 9V battery and amplified by the Tracker
Pre. For comparisons I also have an Earthworks M30/BX. Drivers and microphone are held in position by two
Radio Shack microphone stands. The microphone position in front of the tweeter dome is easily adjusted by the microphone clamp and the extension arm of the stand. The microphone is placed 10 mm from the apex of the dome. Before taking measurements I check out the setup and its operation with an old driver and at low signal levels to avoid costly mistakes, which occur easily at high power levels
|
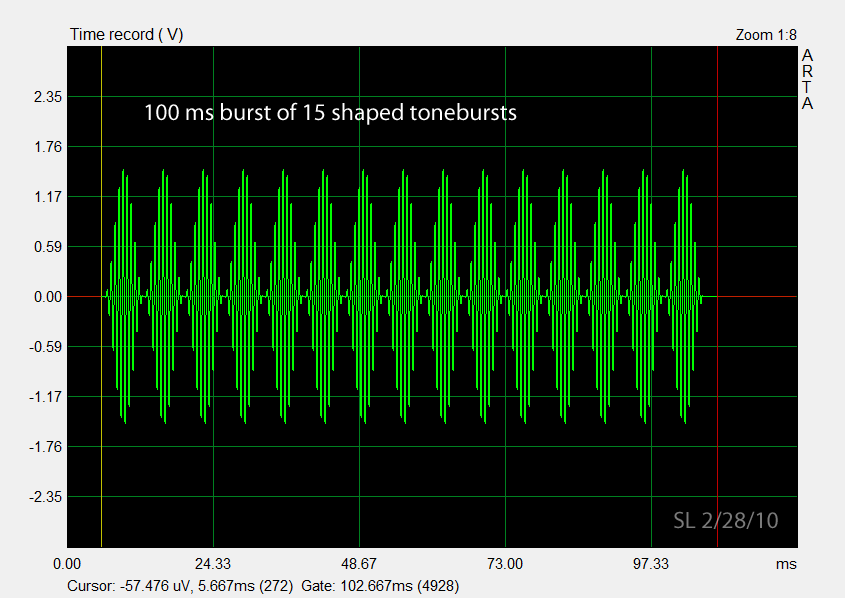
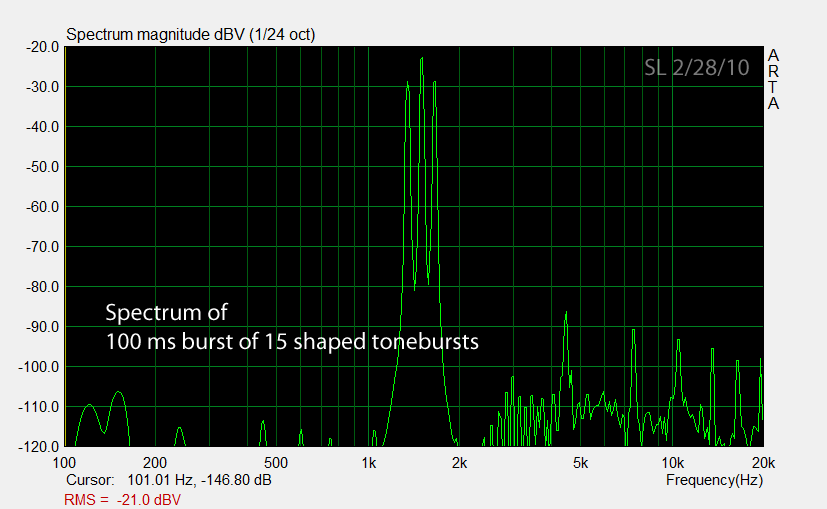
Here now is an example 1.5 kHz toneburst test signal, a single burst to show the waveform details, the 100 ms string of bursts that is applied to the tweeters, and the spectrum of the 100 ms burst. The spectrum shows distortion of the 33120A output signal, but for these tests they are low enough and of no concern.
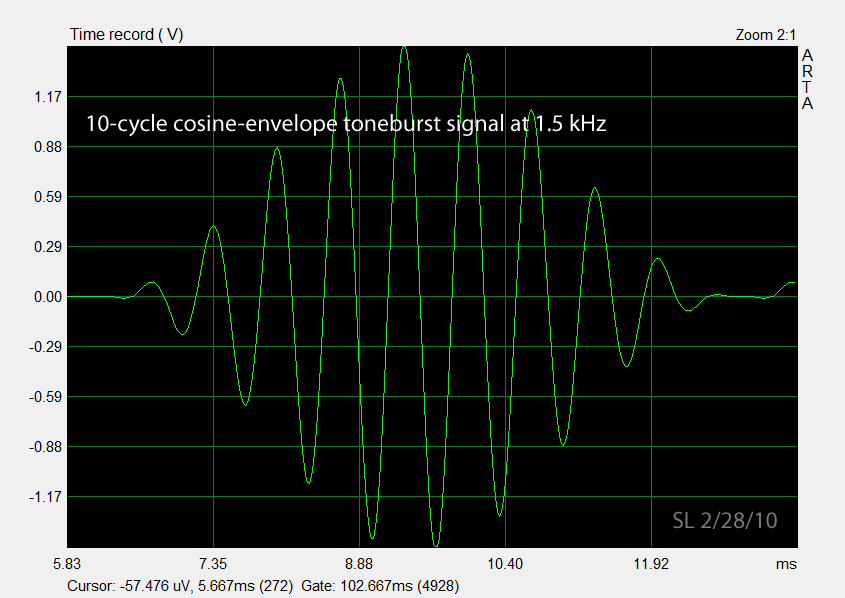
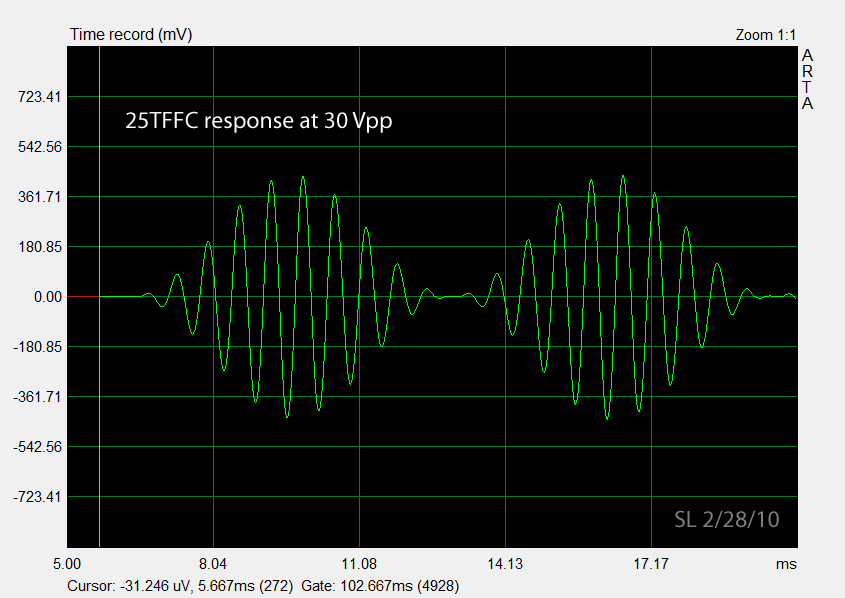
Two tweeters are tested to illustrate the triggered burst measurement. The tests should serve as examples for what can be learned when large signals are applied safely. They are not complete tests. The first driver is a Seas 25TFFC (H-519) soft dome tweeter from a long time ago and the second is a BG Neo3W planar tweeter. The driver terminal voltage is set to 30 Vpp. The signal shape is the same as that of a 100% amplitude-modulated sinewave, where the carrier is at 1.5 kHz and the modulation frequency is 150 Hz. For 100% AM we can derive Vrms = 0.22 Vpp. Thus the 30 Vpp amplitude corresponds to 6.5 Vrms, which would deliver 5.3 W into 8 ohm. A 60 W amplifier, as used for the ORION tweeters, could apply 60 Vpp max to the driver terminals. I have certainly measured 30 Vpp during loud passages.
The microphone output trace appears clean to the eye and identical to the source signal.
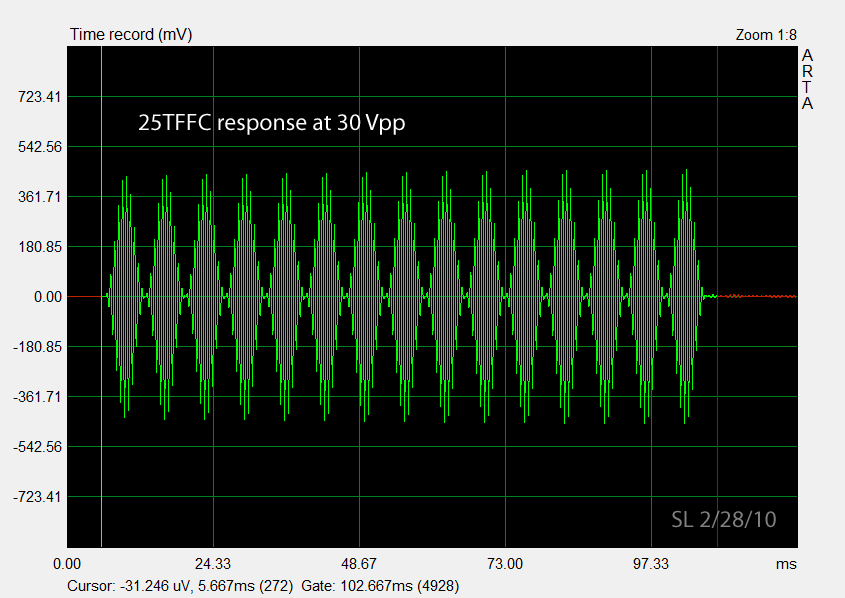
A slight increase in the output envelope can be observed over the 100 ms time duration. This effect becomes more pronounced as the drive signal level is increased. It could be due to Ferro fluid in the magnet gap becoming less viscous as heat increases, which decreases the mechanical damping of the driver.
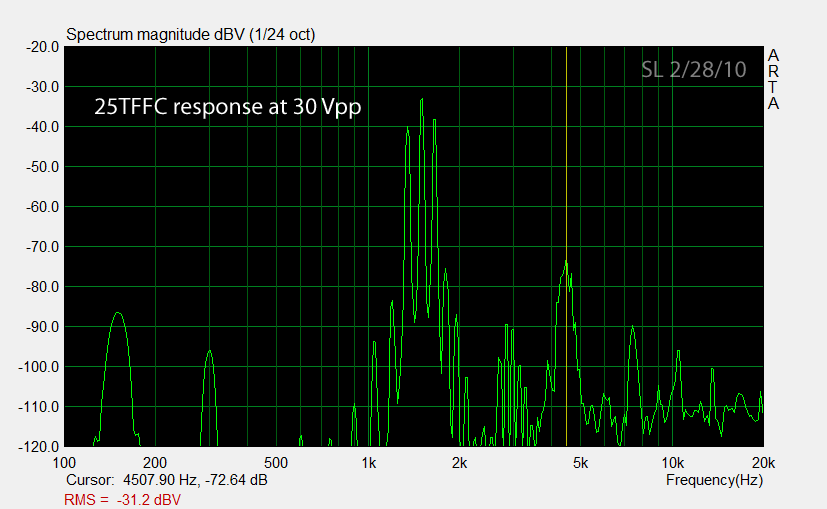
The driver shows primarily 3rd order distortion at -40 dB (1%). Note also the difference distortion products at low frequencies. They are not directly audible, but indicative of the nonlinear parameter at play.
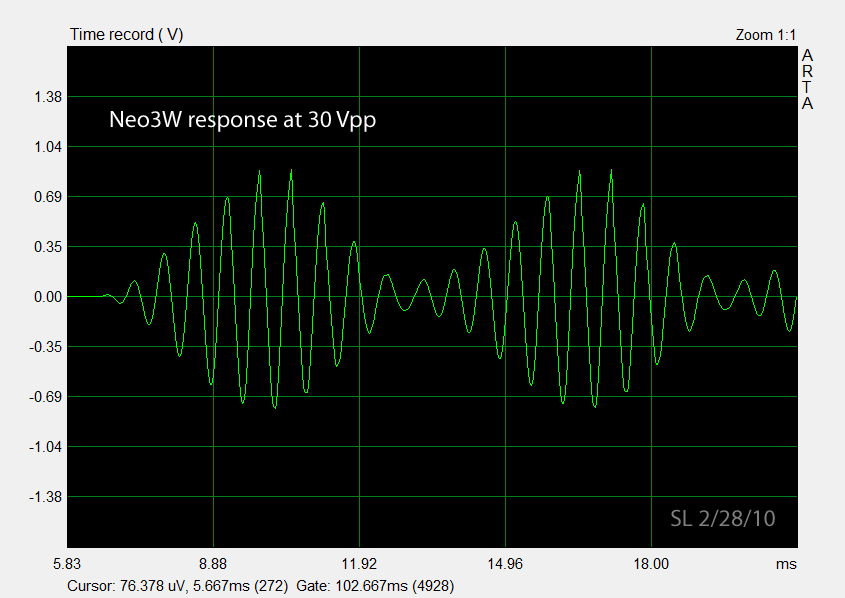
Here we see considerable waveform distortion in the form of sharp peaks and the signal envelope not going to zero between the bursts. The 100% modulation has been reduced to a lower value. The driver has lost articulation. The effect is independent of applied signal level and indicates resonant behavior that is not electrically damped by the amplifier..
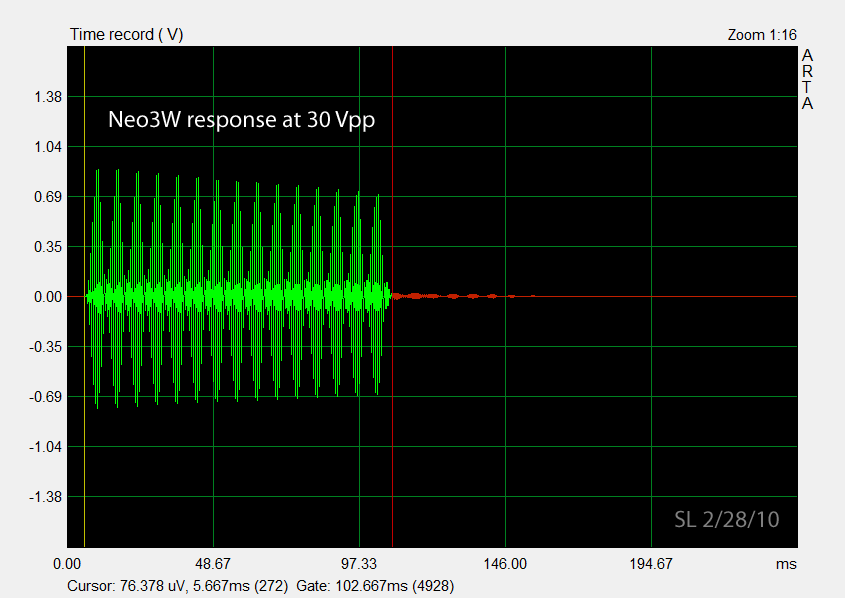
The microphone signal amplitude decreases over the 100 ms duration of the burst. It is probably due to the driver heating up and leads to a 2.3 dB signal amplitude change within this short time when about 5 W were applied. The tweeter shrieks audibly during the test.
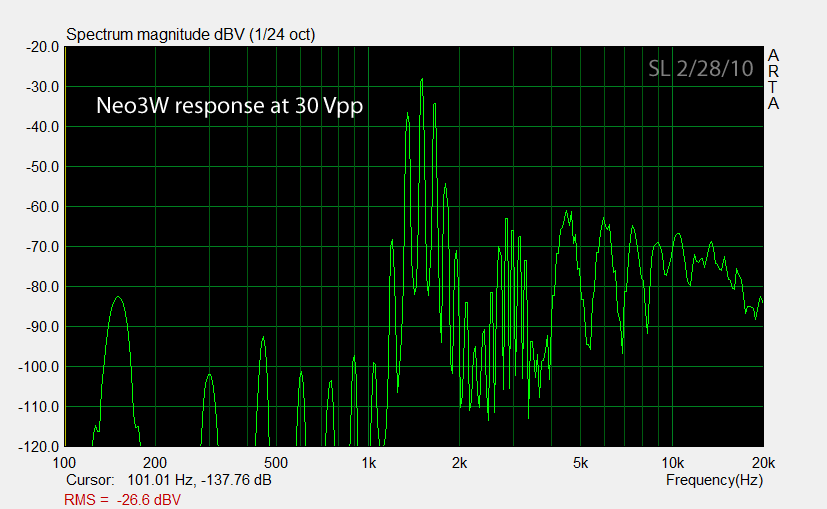
The peak output at 1.5 kHz is about 5 dB higher than for the 25TFFC. So for a comparison at the same SPL either the Neo3W drive signal would have to be decreased to 17 Vpp, which will reduce distortion, or the drive level of the 25TFFC will have to be increased to 53 Vpp. In addition, for dipole application the back cavity of the Neo3W has to be removed, which will increase distortion. Partial cancellation of the front acoustic output by the rear acoustic output will require higher drive levels to maintain on-axis SPL. The lack of a rear chamber is likely to cause additional electro-mechanical problems. The large amount of distortion at relatively low power level would rule out this driver for my applications, which usually require a low crossover frequency.
Note that this is just an illustration of the triggered test method and not a complete evaluation of either driver. Both drivers have their applications, but probably not for the ORION+. The tests clearly show thermal effects. The signal voltage and the burst duration could be safely increased further, to show behavior under extreme conditions and eventually failure modes. These are important tests of the robustness and reliability of a product. Driver manufacturers give some indication of this by their power specifications, which I assume are for safe operation. Their low frequency power limitation is for cone excursion reasons, like distortion and damage.
25TFFC
Via Butterworth highpass at 3 kHz, 12 dB/oct
200 W short term maximum power (for how long?) = 35 Vrms across 6 ohm
80 W long term maximum power (= continuous?) = 22 Vrms across 6 ohm =>
101 Vpp AM burst
Neo3W
Recommended LF crossover point: >1 kHz
(dipole or with a tuned rear chamber or in an array)
10 W RMS (= continuous?) = 6.3 Vrms across 4 ohm => 30 Vpp AM
burst
20 W Program
50 W Peak (for how long?) = 14 Vrms across 4 ohm
For a 100% AM burst with identical power dissipation as a continuous sinewave signal, we have
4.6 Vpp (AM burst) = 1.0 Vrms (sine)
-----------------------------------------------------------------------------
How do I evaluate a stereo loudspeaker system and its setup in a room for accuracy? What do I mean by accuracy, when I know that the recording did not capture the air pressure variations at the ear drums of a person with identical upper body physique to mine? Assuming that my own ear drum signals had been recorded, what does accuracy mean when I play back these signals over two loudspeakers and know that they are not accurately reproduced at my ear drums? Each ear receives direct sounds from left and right loudspeakers and reflected sounds from various directions in the room. My brain tries to make sense out of the superimposed streams of air pressure variations at my ear drums, looking for cues and patterns to segregate the streams. The underlying processes have been described by Theile (1980) via his Association Model and by Bregman (1990) in his book Auditory Scene Analysis - The Perceptual Organization of Sound.
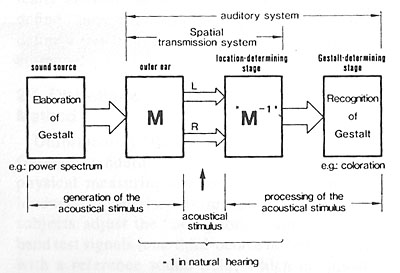 Principal function of the Association Model (JAES, Dec.1986) |
The auditory processing of
the ear signals occurs in two stages. In the first stage the location of
the sound sources is determined using cues from the HRTF and head
movement and without changing perceived spectral content. The second
stage determines the Gestalt of the sound sources, the Auditory Scene in
space and over time.
The first stage responds very quickly and uses primarily high frequency transients in the superimposed sound streams at the two ear drums. It serves as an important survival mechanism in conjunction with stereo vision. The second stage recognizes patterns in the superimposed streams, compares them to memory and makes sense of them. This takes time and involves learning as the perceived auditory scene is rarely static and often evolves as different sources illuminate their physical environment. When they get reflected back to the listener they tell about the Gestalt of the Auditory Scene. |
When I listen to a stereo loudspeaker playback in my room and an AS has formed in my mind, how would I know that what I hear is an accurate replica of an auditory scene that could be had at the recording venue? Or more generally, that this is an AS that could have existed at all? Modern recording techniques use a multiplicity of microphones and place them in locations relative to the sound sources where my ears have never been. It seems impossible to say anything about the accuracy of reproduction from what I am hearing. But, I can ask myself, is what I am hearing plausible? Is it believable? Does it hold up over time or would I rather turn it down because I am getting tired (my brain has to work too much)? Where am I in the AS?
Plausibility then becomes the arbiter for accuracy. All that is not plausible becomes distortion in this context. To recognize plausibility requires familiarity with live, unamplified sound. Everyone is familiar with voice in all its variations, young ,old, far, close, single, in masses, talking, singing and all this in various spaces from outdoors to churches and bathrooms. I have had season tickets for the SF Symphony for decades and the different performances have given me ample opportunity to refresh my auditory memory and to analyze what I am hearing.
Unfortunately, little is usually written about the recording technique that was used and one does not know beforehand whether a particular sound track has the potential to produce a plausible AS. At minimum a main microphone pair with a stereo recording angle that encompasses the whole acoustic source should have been used to preserve the spatial relationship between individual instruments and the response of the venue. This rules out, for example, widely spaced main microphones, which have a very narrow SRA, from recording something plausible, though it may be pleasing. An accurate reproduction system will sort out the effects of different microphone placements upon the plausibility of the AS and would be a trustworthy tool for a recording engineer. To the audiophile such system would simply sound natural and untiring.
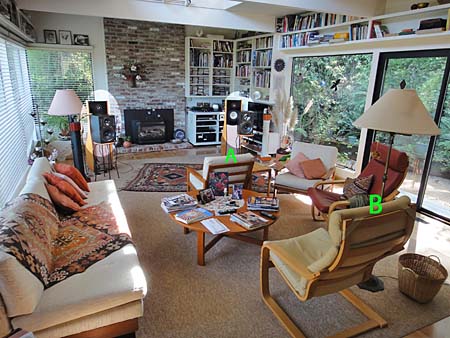 |
I make the claim that
loudspeakers and room can disappear from the AS and that this depends
primarily upon the polar response of the loudspeakers and their setup in
the room. Loudspeakers must be free-standing and at least 1 m away from
adjacent walls. Loudspeakers and listener form an equilateral triangle
that is situated symmetrical to the walls as in A. Greater listening
distances as in B may suffer from diffuseness of the sound stage, but
not necessarily in plausibility of the AS.
I also claim that constant directivity as approximated by ORION+ for a dipole and by Pluto 2.1 for an omni-directional source, provides more often a plausible AS from commercial recordings, than the conventional box loudspeaker with its strongly frequency dependent radiation pattern. But I do not know if there is a more optimal solution than a dipole or omni. Should it be cardioid or which polar pattern is good enough? |
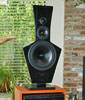
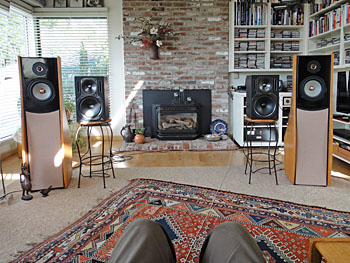
I had experimented with box loudspeakers for a long time, but had not come up with a box design that possessed the nice qualities that I heard in planar electrostatics, despite their obvious shortcomings. So in 1985 I started with dipole designs hoping that I could avoid the dynamic range and beaming problems of planar radiators but preserve their open and natural sounding presentation. I succeeded to my great satisfaction. Later, when I built Pluto I wanted to study diffraction effects and imaging and for that I needed an acoustic point source. I was very surprised when I listened to Pluto and heard how similar it sounded to ORION. Pluto is after all a sealed box speaker, though one with many box problems solved. Recently I purchased a pair of studio monitor boxes, because a group of investigators were using them in AS comparison tests with the ORION+. These Behringer B2031A active 2-way loudspeakers are quite remarkable at their $360/pair price, their material content, design and acoustic performance. They appear to be designed along the lines of Genelec and JBL monitors and probably exemplify the polar response behavior (I have not measured them) that Floyd Toole and colleagues have found to be desirable. They certainly have a different radiation pattern than the ORION and present me with an opportunity to test the usefulness of the concepts of Accuracy, Spatial distortion and Plausibility of the AS, and how comparative testing might be conducted to answer the question about the optimum polar response.
The setup of the loudspeakers can influence the outcome of the comparison test. Some preliminary experimentation is generally necessary to find a configuration that is feasible and that will not distort the acoustic features under investigation too much. I use a pink noise imaging test for this. Pink noise is a broadband random signal and I alter it between L&R incoherent (stereo), L&R coherent (mono), L only, and R only. Under free-field conditions the mono SPL at the listening position would be 6 dB higher than either L or R and 3 dB higher than stereo. In a highly reflective environment mono and stereo will have about the same SPL. The sound track is one minute long and should be repeated multiple times until the listener's brain has reached the steady-state condition of the AS that is caused by a particular pair of loudspeakers.
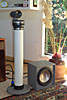
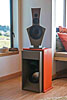
| The two pairs of
loudspeakers were placed next to each other. The ORION in their original
location and the B2031A on the inside. This preserves about equal
distance to the listener, but scales down the angular stereo spread for
the B2031A. It introduces a relative spatial distortion, and must not be
forgotten when considering plausibility of the AS. Initially the B2031A
were placed in front of the ORION as in the photo above. This tended to
spread center imaging of the ORION, especially in seat B, and placed the
B2031A center image in front of the ORION's in seat A.
The 50 Hz low-cut filter was engaged in the ORION xo/eq to reduce the low frequency woofer excursions from the pink noise and to match the two loudspeaker pairs. Relative volume levels were adjusted to be close to 66 dBA for coherent pink noise at seat A. A difference in room response was clearly seen in an A-weighted 1/3rd octave measurement. |
 |
| Given this setup a number of observations can be reported for seat A and seat B. I will present them in tabular form below, because every time I switched from ORION to B2031A, back to ORION and back to B2031A and so on, I noticed a drastic change in the AS. But perception of the character of this change faded fairly quickly after several repeats of the test signal. The brain settled in to a more neutral mode, though some differences still remained. I believe this argues against making quick decisions upon A/B switching between two AS and suggests that one needs to listen for some extended time after switching before coming to any conclusions. I have observed, for example, that adjusting the tweeter level by less that 0.5 dB may not be noticeable immediately as such, but can have a significant long term effect upon the AS. Some time ago I had a frustrating experience when I tried to equalize the ORION's room response by ear to match the Pluto's, by removing the differences that I heard on pink noise. Hearing involves a lot of data processing at a preconscious level. | 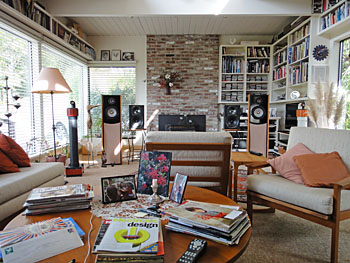 |
A - Pink noise imaging test
| ORION+ from seat A | B2031A from seat A | |
| a) |
|
|
| b) |
|
|
| c) |
|
|
| ORION+ from seat B | B2031A from seat B | |
| d) |
|
|
| e) |
|
|
| f) |
|
|
| g) |
|
B - Preliminary listening to program material and finding a reliable test procedure
| A few preliminary listening tests to program material showed problems with the above loudspeaker setup. From seat A it was obvious that the distance between the B2031A was insufficient compared to the separation of the ORION. The observation was confirmed from seat B even though the change in subtended angle is less from there. Consequently the left ORION was moved 6" towards the center and the B2031A was moved to the outside on the left. It still leaves 1 m from its tweeter to the window. Further listening from seat B indicated that the B2031A had to be raised to bring its tweeter and midrange more in line with the ORION. The symmetry lines for the two loudspeaker pairs are now offset by 43 cm and require a lateral shift of the listening position by +/-21 cm after switching to the other pair of loudspeakers to be located on a symmetry line. The tweeters of each loudspeaker pair are 232 cm apart and 43 cm from each other. The outside tweeters are about 1 m from the sidewalls and 185 cm forward from the wall in front of the listener, In seat A a listener is at 220 cm from the line between the speakers and 420 cm at seat B. | 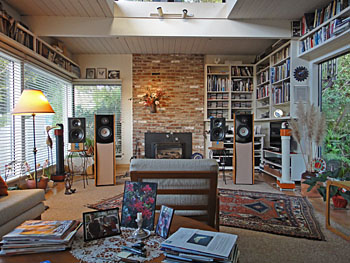 |
The pink noise tests showed that instant A/B
switching can give misleading first impressions about the new AS. This was also
confirmed with program material, where switching instantly pointed to
differences between the two loudspeaker pairs, which on longer listening were
not relevant to the plausibility of the AS. Therefore I adopted the practice of
listening to at least 3 minutes of a sound track and making mental and written
notes of what I observed about the AS. I also adjusted the volume level, if
necessary, for greater plausibility. Then I paused for a minute or so before
listening to the same track again, but now with the other pair of loudspeakers,
possibly readjusting volume level, and taking notes about its AS. This procedure
may be repeated with the same track to confirm any differences in the two AS and
to judge which one is the more plausible AS. Next a different track is chosen. I
like to continue with the last pair of speakers that I listened to. And so on.
When I compared ORION to Pluto a while ago I used frequent A/B switching when
trying to understand the differences between the two loudspeakers. I observed
that upon switching my brain was going through some adjustment, which I
attributed to their differences in room response. After many of such tests the
sensation stopped, but these two loudspeakers sounded to begin with very close
to each other on pink noise. When listening for the AS it seems appropriate to
me to switch between two systems during a period of silence and auditory rest.
It also makes me wonder, if the pressure on the individual in a group test to
produce some results would be reduced, if each participant could listen just by
himself and and as long as necessary, and with a wide variety of program
material, to come to a conclusion about the plausibility of the AS.
(See also the earlier proposal for Testing
a stereo system for accuracy to follow my line of observation and thinking.)
C - Listening from seat B (420 cm)
All the program material that I used for the following tests is from a Sampler that I put together for possible evaluation of various commercial loudspeakers at the CES in 2002. I will list here the CDs from which the 10 of the 17 tracks were taken.
#1 - Ofra Harnoy, Romantic Cello Sonatas,
Chopin-Franck, RCA Victor 09026-61818-2, track 2, Chopin, Scherzo, 4:33
#2 - Swing Live, Bucky Pizzarelli, Chesky JD218, track 7, Lime House Blues, 9:20
#3 - The Roches, Warner Bros. 3298-2, track 5, The Troubles, 3:24
#4 - Come Rain or Come Shine, Sylvia McNair, Philips 446 818-2, track 2, Stormy
Weather, 4:20
#6 - The Dorian Collection, Sampler Vol. 3, From Lieder of Schumann and Brahms
(DOR-90132), DOR-90003, track 18, Schumann, Waldesgespraech, 2:05
#8 - The Dorian Collection, Sampler Vol. 3, From the Scottish Lute (DOR-90129),
DOR-90003, track 9, Gypsies Lilt, 2:32
#9 - John Rutter, Requiem, Reference Recordings RR-57CD, track 9, Agnus Dei,
7:09
#10 - Gil Shaham, Romances, Deutsche Grammophon 449 923-2, track 5, Beethoven,
Romance #1 in G major, 6:13
#11 - Tutti, Orchestral Sampler, Reference Recordings RR-906CD, track 1,
Rimsky-Korsakov, Dance of the Tumblers, 3:48
#17 - Mi Buenos Aires querido, Barenboim-Mederos-Console, Teldec 0630-13474-2,
track 4, Don Agustin Bardi, 3:12
Seat B is far into the room and what I hear from there should be strongly influenced by the radiation pattern of the loudspeakers and the room reflections. The following are my impressions as I wrote them down for each track.
#1 - Cello and piano
B - Plausible, cello booming
O - Plausible, cello more articulate, more space
#2 - Jazz club live
O - Plausible
B - Plausible, no significant difference
#3 - 3 girls and guitar
O - Plausible
B - Plausible and more centered, edgy voices
O - More breazy, group more spread
#4 - Trained female voice, piano, bass
B - Plausible
O - Plausible, no significant difference
#6 - Trained baritone
B - Plausible, well defined
O - Plausible, different but cannot express in words
#8 - Lute
B - Plausible
O - Plausible, softer?, cannot say if anything is significant
#9 - Male and female chorale
B - Plausible
O - Bigger space, more open, more height, deeper bass
#10 - Violin and orchestra
B - Violin and orchestra not hanging spatially together, something is unnatural.
Violin too hard, biting but could be accurate because of closeness to
microphone.
O - Relaxed. Orchestra occupies larger space. Violin more detailed, not as hard.
More plausible presentation. Not as aggressive. But is my high frequency hearing
still adequate for these tests?
#11 - Large orchestra
B - Lacking height? Too small an AS.
O - Bigger window, more realistic bottom. Plausible
#17 - Piano, bandoneon, bass
B - Less engaging
O - More live like
Moving laterally was not necessary. A slight turning of the head centered the AS from seat B.
D - Listening from seat A (220 cm)
#1 - Cello and piano
B - Looking through an elevated and wide window. Sounds are very plausible,
accurate
O - Listening into an open and deeper space. Larger window. It goes to the
floor.
#2 - Jazz club live
B - Shouting, unpleasant guitar. Listening into a box. Individual instruments
are true sounding, but spatially listening through an elevated window.
O - Someone opened the door in front of me. I am looking into a room. Relaxing.
Sax not as unpleasant. Scene fits with wife making noise in open kitchen behind
me.
#3 - 3 girls and guitar
B - Excellent voices and imaging. Most realstic. Horizontal band of voices is
very plausible, except spatially distorted in height and depth. Close
microphones.
O - Group is more distant and in a space. Individual voices not as distinct.
Could be frequency response of O.
#4 - Trained female voice, piano, bass
B - Window view. Voice excellent, close to microphone. Piano and bass on top of
each other spatially.
O - More open and more space, but veiled. Hear the recording engineer at work.
#6 - Trained baritone
B - Plausible spatially and good voice quality. Analytic.
O - More believable voice in a space. Softened.
#8 - Lute
B - Plausible
O - More 3D in a space
#9 - Male and female chorale
B - Window effect. Hole in center, left and right lumps.
O - Open space. Smooth spread between speakers. Deeper bass.
#10 - Violin and orchestra
B - Very clear AS, but floating like an ellipsoidal cloud in front of me in the
room. It needs tapering into the space outside of it.
O - Taking over the space and volume in front of me. Natural sounding.
#11 - Large orchestra
B - Again a floating cloud of sound, not extending to floor and ceiling. Clear
imaging laterally.
O - Taller and deeper AS. More spatial richness. Much larger spatial volume,
particularly noticed on deep bass.
#17 - Piano, bandoneon, bass
B- Pan-potted multiple microphones. Spatially incoherent.
O - Same, but more space around it
The two loudspeaker systems O and B clearly produce a different room response, which is most noticeable on pink noise and when switching between the systems instantly, in the midst of a track. Upon switching the previously perceived AS1 is no longer valid if the auditory cues change due to a different direct signal frequency response, radiation pattern and room reflections. Given some time and listening the immediately noticed difference fades away and a new auditory scene AS2 is formed. The tests here are about AS1 and AS2. They are about steady-state perceptions and not about the switching transient. The switching transient might point to system differences, but the brain can adapt and ignore them if they are not relevant to forming a believable AS. Instantly changing the AS may be analytical but can be highly misleading and lead to conclusions that are not consistent with long-term listening experience. An A/B/X switching protocol is only appropriate if there is a period of silence of at least 30 s after each switch, making it an A/sB/sX protocol.
It appears that the anechoic on-axis frequency response of both systems is comparably smooth. The lack of deep bass extension of B was noticed on tracks #9 and #11 and diminishes the depth of the AS. Subwoofers could easily solve this and it would be interesting to investigate if the character of deep bass is then the same as with O. I have observed at various times that dipole bass can sound more like what I hear in a symphony hall, than box woofer bass. The high frequency room response of B is different from O due to a narrower beam. To test for AS differences ideally both O and B have the identical on-axis anechoic frequency response. This cannot be measured or equalized in a reverberant space. It requires free-field conditions. Equalizing the room response does not make sense when the radiation pattern is under study. The free-field on-axis response of O and B is similar enough, from what I can tell, that no further equalization is necessary, except to extend the low frequency range of B.
The main difference between the two systems is in their spatial rendering and that is more noticeable from the closer seat A. The audibility of a different AS depends strongly on the sound track chosen. On some tracks the AS is confusingly similar for O and B. Where the AS is different for O and B it is not necessarily obvious which AS is more accurate or plausible, particularly when the difference is in the spatial distortion of the AS. Overall I describe the difference in how the two systems and others like it render the AS as follows:
O - Open, spacious AS with fuzzy boundaries like a large ellipsoidal cloud. Depth and height are greater than for B. Individual sources are distinct, articulate and easy to follow and they exist in an acoustical context. The presentation is untiring and this holds up well over time. This means to me that the presentation is easy on the brain, because there is something natural about it. One easily gets lost in the music and forgets about loudspeakers, room, frequency response, etc. Though O readily reveals the work of the recording engineer, one can take it as such and still enjoy the work of the musicians. The sound stage can be large and, though only in front, can make surround sound unnecessary for full music enjoyment. There is a smoothness to the AS, which may be due to the delayed reflections of the direct sound, acting like a tapered window over a time record.
B - In contrast to O system B would have a rectangular window over the AS. What was an ellipsoidal cloud tends towards a 3 m wide and 50 cm tall window that is 70 cm off the floor and through which I am looking into the AS. This may be exaggerated but it points to a spatially less open and closer AS. The view through the window is very clear, the images are less soft. Considering that most recordings use microphone placements that are not representative of natural hearing locations, I can easily imagine that B renders an AS that is more true to the microphone location, than the more spacious and open rendering by O as for track #3, for example. The increased high frequency directivity of B tends towards a headphones presentation, though out of the head and at least 3 m in front. To me headphones can be very accurate transducers in some respect, but the high degree of distance and spatial distortion makes them questionable for AS investigations. System B can deliver a very satisfying AS and possibly a more accurate one than O. The tendency of this type of loudspeaker to reveal less of the context, the space in which sound always exists, makes them less natural sounding to me and tiring after a while. That is why I kept going after dipoles and then found to my surprise that even omnis have this characteristic of giving me a live like AS.
I attribute the audible differences between the
systems primarily to differences in radiation pattern and the ensuing
differences in room reflection patterns. We know that zero reflections, like in
an anechoic chamber, are perceived as unnatural. We also know that un-attenuated
reflections, like in a reverberation chamber, are perceived as confusing.
Somewhere between the two extremes is a comfort zone, determined by the
absorptive characteristics of the room and the radiation pattern of the
loudspeaker, which acoustically illuminates the room. The room is usually a
given. Many different approaches to
loudspeakers are in use.
It seems that several features of the above test
procedure could be useful when trying to find the optimum radiation pattern for
two loudspeakers in an acoustically small room.
------------------------------------------------------------------------------------
| Page 1 | Page 2 | Page 3 | Page 4 | Page 5 | Page 6 | Page 7 |
|
| ||||