Issues
in loudspeaker design - 2
| Page 1 | Page 2 |
Page 3 | Page 4 | Page
5 | Page
6 | Page 7
|
M - Investigation of energy storage
N - Mounting a driver to a baffle
--------------------------------------------------------------------------------------------------------------------------------
M - Investigation of
energy
storage
Mechanical and electro-acoustic systems
often have resonances and thus store energy, which is then gradually released.
This is a linear phenomenon and in theory can always be corrected with
equalizing filters. Thus, the Q of the
electro-mechanical resonance, which determines the low frequency roll-off of a
loudspeaker, is usually controlled or corrected during the design of the
speaker. Equalization may become difficult or impractical in the high frequency
region of a driver's operating range. If that is the case, then the severity of
the resonance in terms of audibility must be assessed or a different driver must
be found. Different tests and data presentations can be used to detect the
presence of resonance. Here they will be applied to investigate a metal dome
tweeter for usability in a speaker of high accuracy in sound reproduction.
1 - The impulse response fully describes a
linear system. The first 3 ms of the tweeter's impulse response (1) accurately
describe its behavior above 330 Hz. The impulse response is made up of a large
number of sinusoids (Fourier components). The longest full sinusoidal period
that is contained in the time window is 3 ms
long, corresponding to 330 Hz. Lower frequency content is progressively less
well defined. The impulse response shows a dominant ringing with a frequency of
around 17 kHz, which is indicative of a resonance.
Additional information can sometimes be gleaned from
looking at the envelope of the impulse, as given by its energy-time curve (2).
The ringing is shown to decay exponentially at a rate of 12.5 dB/ms. If it were
caused by a single 2-pole resonator,
then its 3 dB bandwidth would be 458 Hz and Q = 37. But what is really
happening?
2 - Besides analyzing the impulse response, more
information can usually be obtained from the graphical representation of its
transform into the frequency domain. The magnitude response (3) clearly shows
irregular behavior above 8 kHz, some of which is also noticeable in the phase
response (4). How severe are the response deviations and can they be equalized
readily?
It is important to know how the data were taken. For the
above measurements the microphone was at a distance of 0.5" (13 mm) from
the "diffuser" in front of the metal dome. When the microphone is
moved back, the shape of the response curve changes. Some details are lost,
others are introduced.
The driver was flush mounted on a 12" x 15" flat
baffle. The impulse length was 25 ms for Figure (5). The loss in smoothness of
the curves at greater distance is due to reflections from the baffle edge and
other nearby objects. To minimize these a shorter impulse length could have been
used, but that would have sacrificed low frequency accuracy which was desired
for the following investigation. The microphone was at 0.5" from the
tweeter.
3 - A Fourier transform of the 25 ms impulse
response, starting at time = 0, yields the steady-state frequency response
above 40 Hz. By multiplying the impulse response with a rectangular window that
steps from left to right (1a), sequentially later sections of the response are
transformed into the frequency domain.
With the different frequency response slices stacked
along the time axis you obtain a cumulative spectral decay or waterfall
presentation of the system response. In one graph you have both frequency and
time information, but with some uncertainty and processing artifacts due to the
necessary windowing of the impulse data.
The graph (6) begins with the steady-state response which
persists for some time T0 since the stepped window starts earlier in
the data than the impulse response (1a). The progression of the frequency
response slices with time is better seen from a different angle (7). Note the
peculiar decay behavior below 1 kHz and especially below 100 Hz in (6) and (7).
These are data processing artifacts. How high in frequency do they carry? The
1.2 ms block of decay response curves is barely longer than the 1 ms period of a
1 kHz sinewave. How much amplitude change can you even expect to see for the 1
kHz component during 1 ms?
Around 6 kHz the waterfall drops at a maximum rate. This
rate and the roundness of the amplitude versus time slice is a strong function
of the stepped window rise time (1a). In this case the rise time was 0.15 ms for
a half Blackman-Harris window. A faster rise time would give a steeper decay,
but other artifacts may begin to show, depending upon the nature of the
steady-state response. At 10 kHz and at 15.7 kHz resonant decay behavior can be
clearly seen and with high frequency resolution. But, is it sufficiently
quantifiable information to choose or reject this tweeter in comparison to
another one?
4 - At each frequency the CSD response is related to the
decay transient that occurs when a sinewave signal has reached steady-state
response of the system and is then turned off suddenly. Because the spectrum of
the turn-off step contains lower frequency components than the sinewave, it
excites a system response to these frequencies, but the transient is falsely
added to the display of the original sinewave turn-off response. For the same
reason, rectangular envelope tone burst test signals produce misleading
transient response data. When the envelope of the tone burst is shaped with a
cosine contour or a Blackman window, then the system turn-on and turn-off
becomes gradual and the response becomes indicative only to what is happening in
the the frequency region under investigation.
A 4-cycle shaped tone burst (8) is optimized towards fast
rise and decay, while containing its spectral envelope (9) so that it still
provides adequate frequency resolution. This signal operates in the
"fuzzy" domain. Plotting the peak amplitude of the envelope gives a
dynamic frequency response of the system, which can look different from the
steady-state response. Observation of the decay of the burst response shows
dynamic, time domain system behavior. Both amplitude and time tests using this
test signal have shown strong correlation to subjective impressions. This type
of signal has been the basis for a useful test
system. Today, it should be part of sound card based computer test software.
The response should be presented like a waterfall graph with a frequency and a
number of cycles axis, rather than frequency and time axis like the CSD.
For stored energy evaluation I compare the shape of the
test signal to its response. The delay between the two is due to sound
propagation and system delay. That in itself is of low importance in most cases
compared to the decay response which shows the effects of energy storage.
The 3 kHz response (10), for the tweeter above, is in the
midst of its flat frequency response region (6). It shows good transient
behavior. The response to all the frequencies indicated in (6) is given below.
Note that all the burst responses below 3 kHz look as
expected, unlike the CSD (7).
Clearly this driver has problems above 10 kHz. The cause
for the resonance is the "diffuser" cap. It forms a Helmholtz
resonator by the compliance of the air trapped between cone and cap, and by the
mass of a doughnut shaped ring of air around the circumference of the gap
between cone and cap. Removing the cap causes severe roll-off in the high
frequency response. Equalization of the modified
driver might be a possibility. Whether it is worthwhile depends on the driver's
non-linear performance, which requires different tests to determine.
The impulse, ETC, frequency, CSD and tone burst response
give different representations of the same reality. Some are easier to interpret
than others. Some are more related to certain aspects of linear distortion.
There may be preferences depending upon one's experience with relating a visual
feature to an auditory sensation.
Further reading:
[1] Siegfried Linkwitz, "Shaped Tone-Burst
Testing", JAES,
Vol. 28, No. 4, April 1980, Abstract
[2] J. D. Bunton, R. H. Small, "Cumulative Spectra, Tone Bursts, and
Apodization", JAES, Vol. 30, No. 6, pp. 386-395, June 1982
[3] O. Dossing, "Uncertainty in Time-Frequency Domain
Representations", Sound and Vibration, Vol. 32, No. 1, January 1998, pp.
14-24
[4] Jochen Fabricius, "Eine alternative Methode zur Berechnung des
kumulativen Zerfallspektrums". An
alternative method for calculating a CSD. The system impulse response is
convolved with shaped tone bursts. The derived waterfall presentation allows the
visual separation of reflections from resonances. The conventional time axis is
replaced by periods of the tone burst. (In German)
[5] Ivo Mateljahn, Heinrich Weber, Ante Doric, "Detection
of Audible Resonances", 2007. From the Support page of the ARTA
Audio Measurement and Analysis Software website.
Part 2 is a comparison between two high quality
8" drivers using CSD and burst tests.
N - Mounting a
driver to a baffle
A cone type electro-dynamic driver is primarily a
generator of mechanical vibration force and heat. It sets air into motion, but
the reactive force of the air has insignificant influence on its behavior. For
acoustic and mechanical reasons a driver is always mounted to a baffle of some
form. Thus the forces generated in the driver try to set the baffle into motion.
The resulting whole body movement is usually a small fraction of the cone
movement and governed by the relative masses of cone and baffle. Mms vcone
= Mbaffle vbaffle. Since the cone velocity vcone decreases
with increasing frequency for constant SPL, the whole body motion is usually
only noticeable at low frequencies and causes an insignificant reduction in SPL.
This is a non-resonant phenomenon and no energy is stored.
Take, for example, two woofer drivers where each has a
cone of 135 g moving mass and both are mounted in a box of 60 lb total weight or
27 kg mass. The box will want to move in reaction to the cone movement by 270g /
27000g = 1 /100 of the cone. Thus a cone displacement of 10 mm leads to a box
displacement of 0.1 mm in the opposite direction. You can feel this readily by
lightly touching the box. The effective movement is 9.9 mm, and a reduction in
acoustic output by 0.1 dB which is insignificant.
Fundamentally different from this is the excitation of
panel vibration modes. These are always resonant, store energy and can radiate
sound. Usually the baffle or box surface is larger than the cone area. Thus
small modal displacements can lead to more sound being radiated directly from
the baffle or box at certain frequencies than from the cone. Knocking with your
knuckle on a panel can give you a rough idea of the dominant mode frequency,
though it might not necessarily get excited by the driver. This test can also
tell you how stiff the panel is, when the pitch is high, or how well the panel
is damped because it hurts to make it respond.
It is illustrative to look at the forces generated by a
midrange driver at a given Sound Pressure Level.
|
Seas W22EX001 |
|
|
|
Piston Xpeak |
Piston force |
Kinetic energy |
|
|
|
|
|
|
|
Frequency |
Monopole |
Dipole |
Monopole |
Dipole |
Monopole |
Dipole |
|
|
|
SPL at 1m in free-space = |
90 |
dB |
|
Hz |
mm |
mm |
N |
N |
mWs |
mWs |
|
|
|
|
|
|
|
20 |
27.3 |
318.0 |
6.1 |
70.8 |
58.36 |
680.60 |
|
|
|
Piston area Sd = |
220 |
cm^2 |
|
28 |
13.6 |
112.4 |
6.1 |
50.1 |
29.18 |
240.63 |
|
|
|
Piston acceleration |
30.9 |
x 9.81 m/s^2 |
40 |
6.8 |
39.7 |
6.1 |
35.4 |
14.59 |
85.08 |
|
|
|
|
|
|
|
57 |
3.4 |
14.1 |
6.1 |
25.0 |
7.30 |
30.08 |
|
|
|
Moving mass Mms = |
20 |
g |
|
80 |
1.7 |
5.0 |
6.1 |
17.7 |
3.65 |
10.63 |
|
|
|
Piston force |
6.1 |
N |
|
113 |
0.9 |
1.8 |
6.1 |
12.5 |
1.82 |
3.76 |
|
|
|
Piston force |
1.4 |
lb |
|
160 |
0.4 |
0.6 |
6.1 |
8.9 |
0.91 |
1.33 |
|
|
|
|
|
|
|
226 |
0.2 |
0.2 |
6.1 |
6.3 |
0.46 |
0.47 |
|
|
|
Dipole path difference D = |
250 |
mm |
|
320 |
0.1 |
0.1 |
6.1 |
4.4 |
0.23 |
0.17 |
|
|
|
Fequal |
233 |
Hz |
|
453 |
0.1 |
0.0 |
6.1 |
3.1 |
0.11 |
0.06 |
|
|
|
|
|
|
|
640 |
0.0 |
0.0 |
6.1 |
3.0 |
0.06 |
0.03 |
|
|
|
Force factor Bl = |
9.0 |
N/A |
|
905 |
0.0 |
0.0 |
6.1 |
3.0 |
0.03 |
0.01 |
|
|
|
Voice coil current |
0.67 |
A |
|
1280 |
0.0 |
0.0 |
6.1 |
3.0 |
0.01 |
0.01 |
|
|
|
|
|
|
|
1810 |
0.0 |
0.0 |
6.1 |
3.0 |
0.01 |
0.00 |
|
|
|
Voice coil resistance = |
6.0 |
ohm |
|
2560 |
0.0 |
0.0 |
6.1 |
3.0 |
0.00 |
0.00 |
|
|
|
Power dissipation |
2.7 |
W |
|
|
|
|
|
|
|
|
The above excerpt from the spreadsheet SPL-dependent.xls
is based on the textbook theory that
was given in Publication
(4). Note that at 90 dB SPL the 20 g moving mass, Mms, of the driver
generates a g-force of 6.1 N or 1.4 lb rms between basket rim and magnet, a
sinusoidal oscillating force of +/-2 lb peak. The cone undergoes a constant
value acceleration of 30.9 g rms, or +/-43.6 g peak, at all frequencies. The
peak cone excursion, Xpeak, is of course strongly frequency dependent and
decreases as 1/f2. The kinetic energy, 1/2 m v2, falls off as 1/f2.
This same driver mounted on an open baffle and equalized to remove the 6 dB/oct
dipole cancellation will have larger excursions below Fequal
than when in a closed box. Therefore the forces are larger and frequency
dependent. Likewise the kinetic energy is higher, but falling off as 1/f3.
The spreadsheet also shows the large force and
extreme acceleration experienced by a tweeter dome, though the kinetic energy is
quite small due to a low moving mass.
There are several ways to reduce modal panel vibrations.
Because the vibration energy from the driver decreases rapidly with increasing
frequency it is advantageous to push the panel vibration modes up in frequency
where the excitation energy is small. This is best accomplished by increasing
the panel stiffness, but often goes together with increasing the mechanical Q of
resonance. Dampening the panel by using a constrained layer that dissipates
energy will reduce Q. Panel stiffness is also obtained by extensive bracing. As
my rule of thumb, no un-braced box panel area should be larger than 4 inch
squared for 3/4 inch thick wood panels. That is a lot of bracing, but it pushes
modes into the low kHz range.
Increasing the thickness of a panel makes good sense when
the resulting increase in stiffness is larger than the increase in mass.
Otherwise modal resonance could occur lower in frequency than for the thin
panel. Still, the increase in mass requires larger amounts of excitation energy
and can therefore be beneficial.
Panel vibration modes are not only excited by structure borne vibration energy
but also by air borne vibration such as the large sound pressure inside a box
loudspeaker. Even if the box panels are infinitely stiff, secondary delayed
sound will leak out through the thin cone material at higher frequencies where
air modes can exist inside the box. A perfect acoustic
resistor to absorb all sound is not available.
There is yet another potential problem with the driver to
baffle interface, even if the baffle is perfectly inert. It is related to the
mechanical construction of the driver itself and how it can become a mechanical
resonator of its own.
Typically a loudspeaker driver has screw holes in its
basket for mounting it to a baffle. Usually a sealing gasket is placed between
the driver basket rim and the baffle. The driver becomes in effect stiffly
clamped to the baffle. This method sets up a mechanically resonant structure
which is formed by the compliance of the basket and the mass of the magnet as
seen in figure (A).
 |
A) Drivers with a stamped metal baskets are
prone to exhibit a high Q resonance when tightly clamped to the baffle.
The magnet moves relative to the voice coil at the resonance frequency.
Energy is stored and also readily transmitted from the moving mass of the
cone into the cabinet.
B) Soft mounting the driver basket to the baffle
using rubber grommets reduces the resonance frequency. A 2nd order lowpass
filter is formed that reduces the transmission of vibration energy from
the moving cone to the baffle and cabinet. The resonance must occur below
the operating range of the driver.
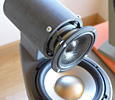
C) If the driver is mounted from the magnet and the
basket rim touches the baffle only softly, then the magnet-basket
resonance cannot occur and the transmission of vibration energy into the
baffle is minimized. |
The basket-magnet resonance can be measured with an
accelerometer that is mounted to the magnet. The drive signal is optimally a
shaped toneburst. Its energy is concentrated in a narrow frequency band. When
tuned to the right frequency a long decay tail becomes visible on an
oscilloscope. Often the resonance can be seen as a small bump in the driver's
impedance curve in the few hundred Hz range. It should not be confused with the
higher frequency bump due to cone breakup.
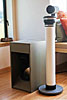
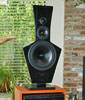
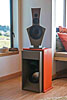
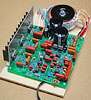
 |
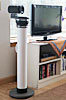
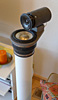
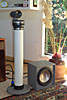
An early example of a box
loudspeaker where a KEF B110 midrange/woofer driver magnet is clamped to a
support structure. The clamp can be tightened from the outside of the box.
The basket rim is floating.
|
Often the effects due to driver mounting are deemed to be
of secondary importance to the overall sound quality of a loudspeaker. They are
usually costly
to remedy. They cannot be ignored when the goal is to design a loudspeaker
of the highest accuracy.
| Page 1 | Page
2 | Page 3 | Page
4 | Page 5 | Page
6 | Page 7
|
| 
