|
|
|
Recording & Rendering--- Recording
& Rendering 101 --- Acoustics vs.
Hearing
--- Subjective evaluation ---
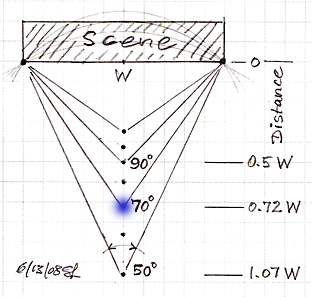
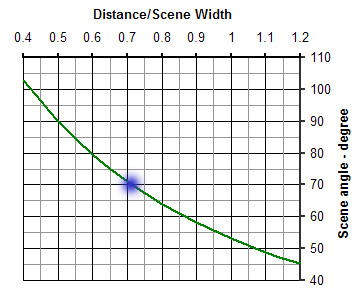
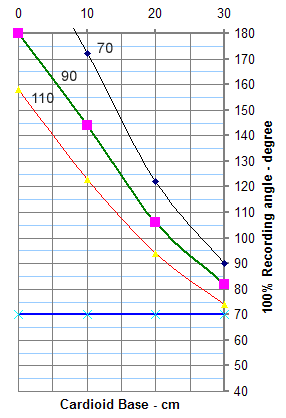
Stereo Recording AngleThe directional microphone pair of the 4-microphone array is placed at some distance from the orchestra or choral group, in order to capture a balance of the various direct sounds. The actual distance is determined by walking towards and away from the musicians and listening for the integration and clarity of the sound sources. This will include some hall reverberation and early reflections. The distance that you arrive at will be much greater than the reverberation radius or critical distance of individual instruments and voices that is typically used as a criteria for placing spot microphones. At the chosen distance the scene might subtend, for example, a 700 angle between left most and right most performers. The stereo microphone pair should map the recording venue scene to the region between Left and Right loudspeakers in the playback environment. A good target would be the +/-75% points in the normal equilateral triangle setup of loudspeakers and listener.
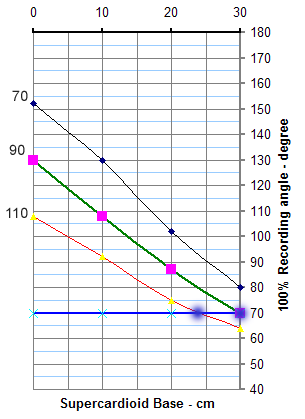
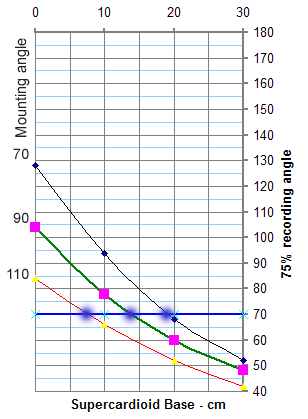
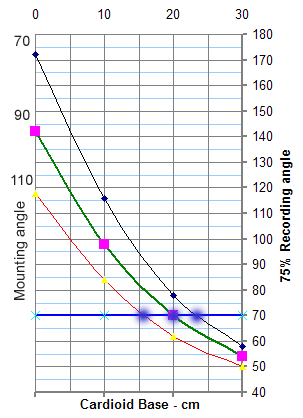
The stereo recording angle, SRA, of the 2-microphone array is a function of the type of directional microphone used, of the mounting angle between the microphones and of the spacing between them. The SRA can be conveniently read from Helmut Wittek's IMAGE Assistant 2.0 on the hauptmikrofon.de website. Below I have plotted 100% recording angle values for full Left to Right loudspeaker mapping and 75% angles for a slightly wider view of the recording venue scene. I think that the 75% angles are actually better defined. The derivation of recording angles is shown later. The plots are for 700, 900 and 1100 degree mounting angles, and for 0 to 30 cm spacing, and for cardioid (r = 0.5 + 0.5 cos(a)) and supercardioid (r = 0.366 + 0.634 cos(a)) polar responses. The data points for the curves are based on perceptual observations and therefore carry some uncertainty. The graphs should be analyzed for trends in order to find the optimum microphone array configuration. Assuming supercardioid microphones and the 700 view of the scene from above one could obtain a 100% SRA with microphones that are spaced 23 cm apart and angled at 1100 or one could use a 900 mounting angle and 30 cm separation. It may seem counter-intuitive that the recording angle becomes narrower as the mounting angle widens, but this is a function of the polar response and the ratio of left and right microphone output voltages. The SRA for a fixed mounting angle also becomes narrower as the mounting base widens.
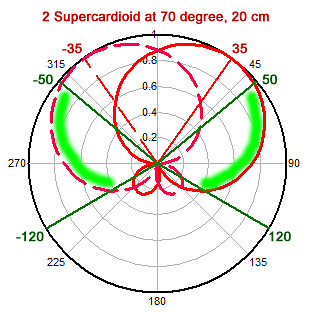
Derivation of the Stereo Recording AngleThe stereo recording angle is defined by the source directions for which sound is first mapped to the Left and Right loudspeakers. An equilateral triangle playback setup is assumed with 600 angles. I will use the example of two supercardioid microphones at 700 mounting angle and 20 cm spacing to derive the corresponding SRA. From the IMAGE Assistant it is found to be 1020.
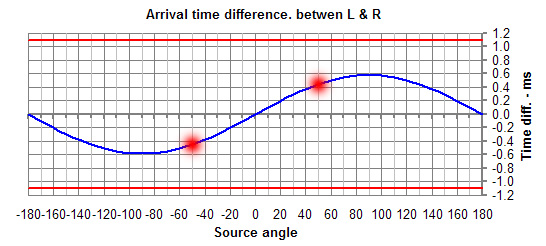
A 20 cm spacing between the microphones gives a maximum time difference of 0.59 ms when the source signal arrives from 900. The difference becomes zero when the signal arrives from the front at 00. It varies as the sine of the source angle. This spacing is not enough to move a signal fully to the left or right loudspeaker.
A look at the phase difference for 20 cm microphone spacing reveals that phase can become ambiguous for frequencies above 850 Hz. It is uniquely defined as being less than 1800 for lower frequencies.
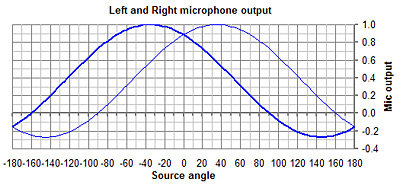
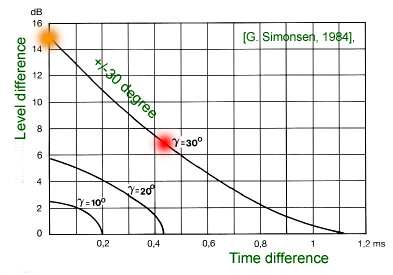
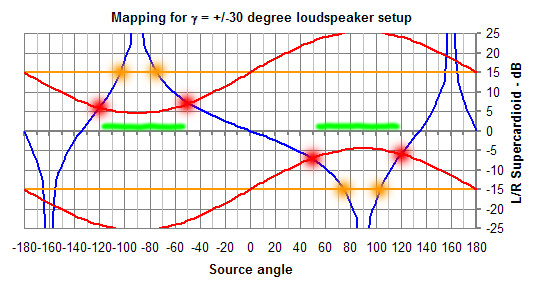
The ratio of Left to Right microphone outputs in dB is shown as the blue curve below. The orange lines at +/-15 dB indicate the threshold for mapping the phantom image to the Right or Left loudspeaker. Where they intersect is the SRA for coincident microphones, in this case at +/-750 for a total angle of 1500. The second intersection at +/-1030 indicates the angles beyond which the phantom image shows up between the loudspeakers again.
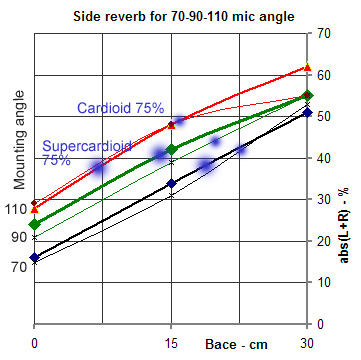
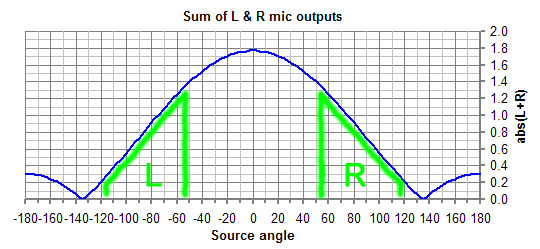
Added to the 15 dB threshold line is in red an empirically scaled version of the arrival time difference curve from above. Where it intersects the blue curve is the SRA for 20 cm microphone spacing. It has been reduced from the 1500 for coincident microphones to +/- 500 or a 1000 total for the spaced microphones. The rearward SRA is now +/-1200 and also has been reduced. What has increased is the monophonic reverberation region in green which now goes from +/-500 to +/-1200. The blue curve below shows the sum of Left and Right microphone outputs on linear scales. The mono reverberation region is bounded by the green shades. It is of interest to know the percentage of the green areas in comparison to the total area under the blue curve. An approximate integration yields a value of 42%. The total stereophonic reverberation is the remaining 58%. The rear contribution to that is from angles beyond +/-1350.
The above described model yields SRA values that are in good agreement with those from the IMAGE Assistant for various microphone types, mounting angles and spacing, but it goes beyond +/-900 input source angles and covers the complete circle around the microphone array. This is important to visualize the mono or side reverberation contribution. The model is readily implemented in a spreadsheet.
--------------------------------------------------------------------------------------- | ||||||||||||||||||||||||||||||||||||||||
|
| ||||