|
|
|
Loudspeaker & Room characterization+++ Test & Measurement +++ Phantom center +++ Case studies +++ Test & Measurement
|
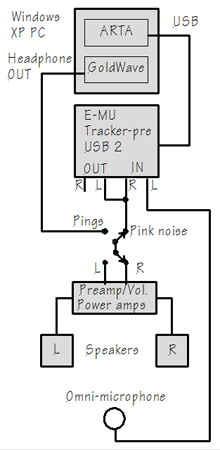 |
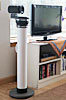
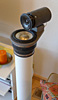
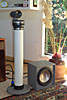
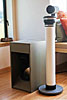
Test EquipmentAcoustic measurements of loudspeakers in a room require an omni-directional microphone, a computer with acoustic measurement software, a sound card and a signal generator. I use a Netbook PC with Windows XP, which runs ARTA and GoldWave. My external sound card is the E-MU Tracker pre. Only its driver is installed on the PC. The microphone is a modified Panasonic electret capsule with external 9 V battery supply. GoldWave is used to play the following ping signal files and to trigger ARTA to record them: 200-12800Hz_1600.wav (1/2 octave steps) 40-400Hz_800.wav (1/3rd octave steps) 20-50Hz_100.wav (1/3rd octave steps) To hear the phantom center I play: phantom_12800-100Hz_spaced_100_500ms.wav (1/3rd octave steps) |
A loudspeaker is typically measured under free-field conditions, where sound reflections are highly attenuated such as in an anechoic chamber, or outdoors where the reflected signal paths are much longer and thus the reflections much weaker than the direct signal from a speaker and/or the impulse response is gated to exclude reflections. Every speaker designer measures the "on-axis response" and usually tries to get it as flat and extended as possible. Sometimes a specific slope or dip is introduced to the response to suit a particular taste or recording style.
Sometimes the response is measured and optimized for a particular "listening window" like +/-30 degree horizontal and +/-10 degree vertical from the listening axis, but rarely over wider angles than that. Yet once the speaker is placed in a room its radiation at all angles contributes to the sound pressure at the listening location to a degree that is determined by the speaker's 360 degree polar patterns and the room's reflective, diffusive and absorptive properties.
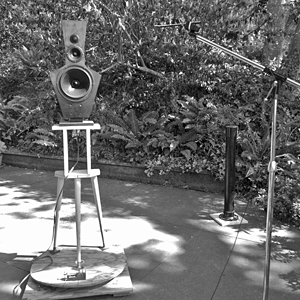
Figure 10: Polar frequency response |
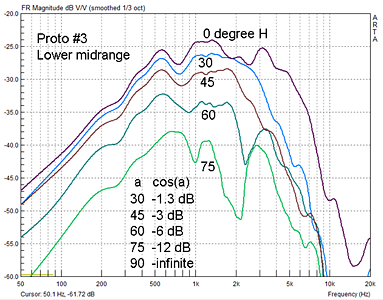
Figure 11: Horizontal
frequency response of the lower |
From: |
The loudspeaker and room interaction can be minimized by
making the room acoustically dead so that the direct sound from the speakers
dominates over the reflected and reverberated sound streams. This works for
professional mixing studios and acoustic work environments but is not a pleasant
living space. Dedicated home theater rooms are often designed to be highly
absorptive.
The interaction can also be minimized by making the speakers highly directive.
But for physical size reasons this is only practical for frequencies above 1
kHz. All box loudspeakers have the tendency to become increasingly directional
with increasing frequency as baffle and driver dimensions are no longer small
fractions of a wavelength in size. Box loudspeakers turn into omni-directional
radiators as frequency goes down and the box dimensions become small compared to
the wavelength of radiated sound. Increased directivity at high frequency
has the undesirable effect of making the stereo speakers sound like headphones
at a distance, firmly bounding the phantom scene between left and right
speakers. It can also convey great clarity of sound, but at the expense of a
realistic and believable phantom scene.
I have found that the perceived interaction between loudspeaker and room is minimized, if the speaker's radiation pattern approximates that of a dipole, cardioid or monopole (omni), the LX521 being my prime example. These types of speakers have essentially the same radiation pattern from the highest to the lowest frequency emitted and thus radiate off-axis the same sound spectrum as on-axis. The reflected and reverberated sound streams in the room thus carry to a first order the same information as the direct sound stream, only delayed due to speaker placement. This apparently allows our ear/brain hearing apparatus to sort out the direct streams from the rest and focus attention upon the recorded acoustic scene in its own spatial context and to withdraw attention from the two loudspeakers and listening room.
Much has been investigated and is presented by Floyd Toole in Sound Reproduction - Loudspeakers and Rooms. Far from "being fundamentally flawed" I have found that a 2-channel stereo system is capable of greater spatial realism and believability than n-channel systems typically achieve. Rather than overpowering the brain into surrender to direct sound streams from n-directions for forming a spatial impression, a 2-channel playback cooperates with evolutionary hearing mechanisms, provides a minimum set of spatial cues from two direct streams and from room streams of sound for rendering a frontal auditory scene, which is familiar when appropriately recorded. The perceptual apparatus fills in when cues are missing, but gets distracted when cues won't fit with the formation of a believable mental image and leads to the question: Where am I?.
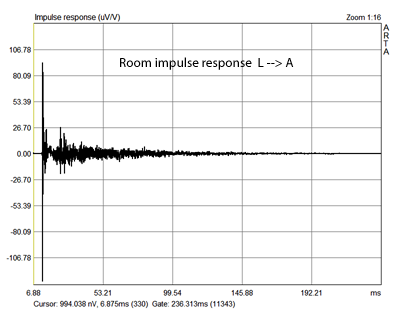
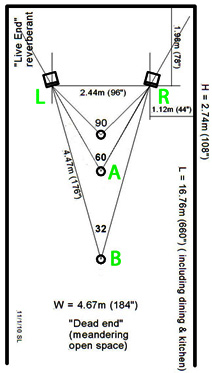
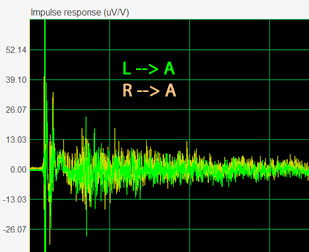
The impulse response of the the signal transmission from loudspeaker L to the microphone at location A consists of the direct signal's impulse response followed by and superimposed with the impulse responses of the direct signal's reflections by various objects and reflections in the room as the initial signal bounces around in the room and decays over time. Location A is at the stereo sweet spot, at the apex of an equilateral triangle formed by loudspeakers and listener. Location B is at about twice the distance from L as is A.
 |
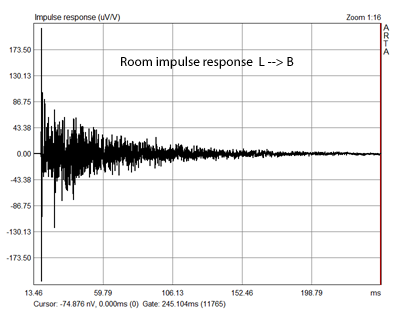 |
The graph on the right shows that
the reflections at B are much larger relative to the direct signal impulse than
at A. The exponential decay of reflections is also more clearly visible.
Listening to the speakers from location B gives a more diffuse sound stage due
to a decreased direct-to-reverberant signal ratio.
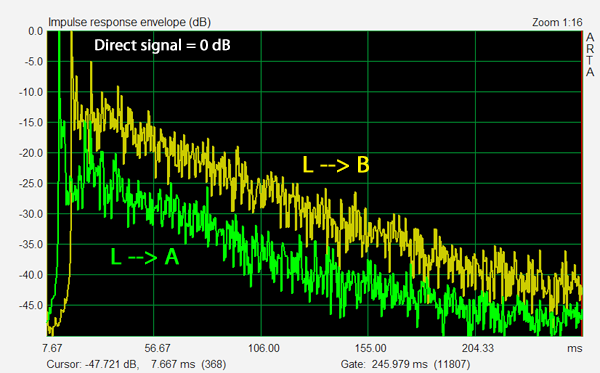
The linear amplitude display of the impulse response cannot show low level
detail. For that the display must be logarithmic as in a display of the envelope
of the full-wave rectified impulse response below. Furthermore with the
amplitude of the direct signal normalized to 1 or 0 dB the relative magnitude of
the reverberant decay at A versus B becomes clearly visible. D/R is about 10 dB
higher at location A.
 |
 |
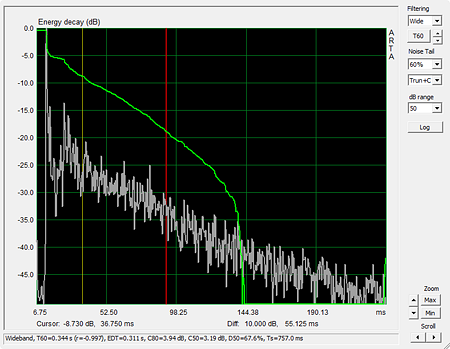
The decay follows a straight line on average with a slope of about 15 dB per 100 ms, which gives an estimate of 400 ms for RT60 from the wide spectrum impulse envelope decay. A more precise measurement of the decay characteristics is obtained from a time-reverse integration of the L to A impulse response envelope as shown by the Energy decay curve (green) in the two graphs below. With an amplitude difference of 10 dB and a time difference of 55.125 ms between yellow Cursor and red Marker, the wideband decay time becomes 331 ms when extrapolated to 60 dB.
 |
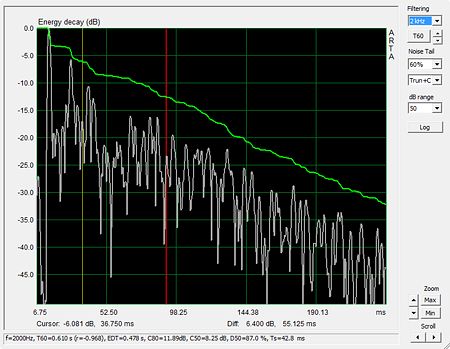 |
When the wideband envelope is octave bandpass filtered at
2 kHz, for example, and reverse integrated, then RT60 = 517 ms for a difference
between cursor and marker of 6.4 dB and 55.125 ms in the Energy decay curve. The
envelope decay curve shows individual reflections as they arrive at the
microphone.
Note the step between 0 dB for the direct signal and the maximum value for the
integral of the decaying energy. In this example the step is about 5 dB for the
wideband case and 3 dB for the 2 kHz octave.
 |
 |
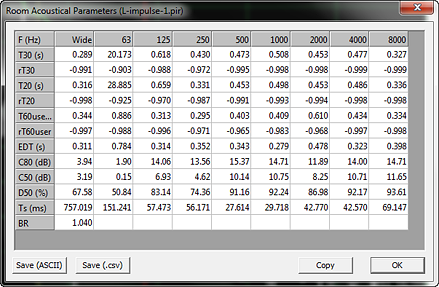
The Energy decay can be investigated selectively in octave bands centered from 63 Hz to 8000 Hz for various quantities and the results tabulated. The ARTA manual describes the derivation and meaning of the terms. They are descriptive for the behavior of acoustically large spaces, like concert halls. I am not sure that they carry the same meaning for typical size living spaces.
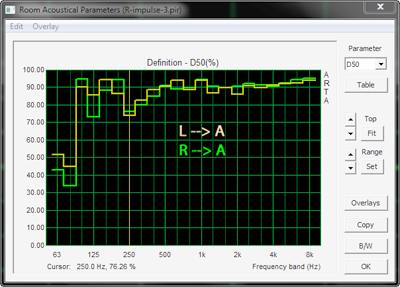
In ARTA the steps from (Analysis > ISO3382 - acoustical parameters > Graphical presentation for 1/3 octave bands) lead to an automatic, standardized evaluation of the impulse response and its graphical presentation. Of all the parameters available I think "Definition (Deutlichkeit)" could be a useful parameter for comparisons between between left and right loudspeakers microphone locations or room setups. "Definition" is the ratio of energy in the first 50 ms of the impulse response to the total energy of the impulse response. For a perfectly symmetrical stereo system the Definition would have identical values for the sound transmission from L to A and R to A to produce a precise center phantom source. I recommend to perform a perceptual test of the center image as described in Phantom center before undertaking room acoustic measurements. It helps to correlate what is heard to what is measured.
 |
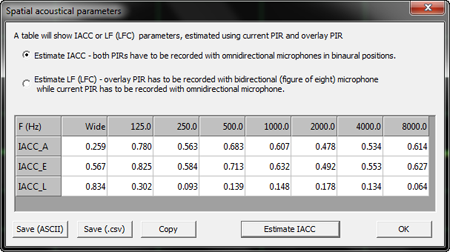 |
Left and right loudspeaker room impulse responses can also
be correlated mathematically by using the "Estimate IACC" function of
ARTA. Though intended for binaural investigations with two microphones the L and
R impulse responses from a single microphone can be overlaid to estimate their
cross-correlation.
IACC_A in the table is the cross-correlation between
the complete impulse responses.
IACC_E (E = early) cross-correlates the first 80 ms only and
IACC_L (L = late) cross-correlates the two responses from 80 ms to their end.
The late parts of the impulse responses are weakly correlated approaching a
random or diffuse sound response in the room. The absolute value of the early
correlation and the ratio of early to late correlation could be of value to room
analysis for stereo.
The stimulus signal, like pink noise, from which the impulse response L to A or R to A will be derived, has to be applied for long enough duration that room modes can build up fully and the decay of reflections and modes can be observed in the impulse response. The rise time of a single mode is Trise = T60/pi or about 1/3rd of its decay time to -60 dB of maximum amplitude. If we assume RT60 = 1 s and we want to see 60 dB of decay, then the pink noise stimulus should have at least 1.33 s duration. (Room Acoustics)
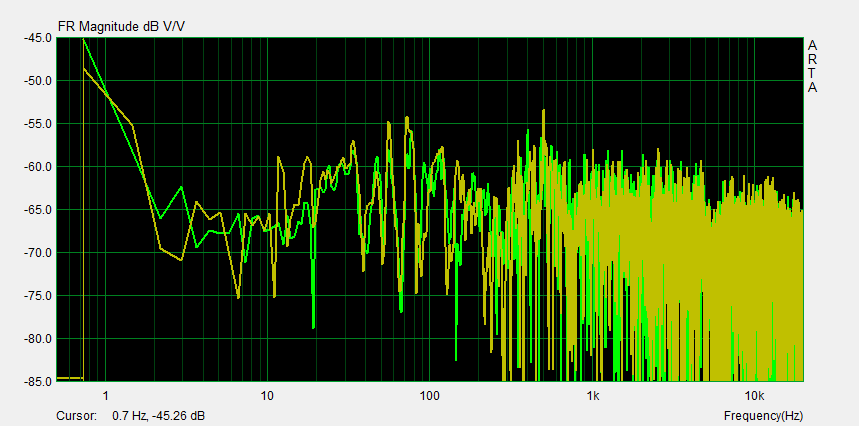
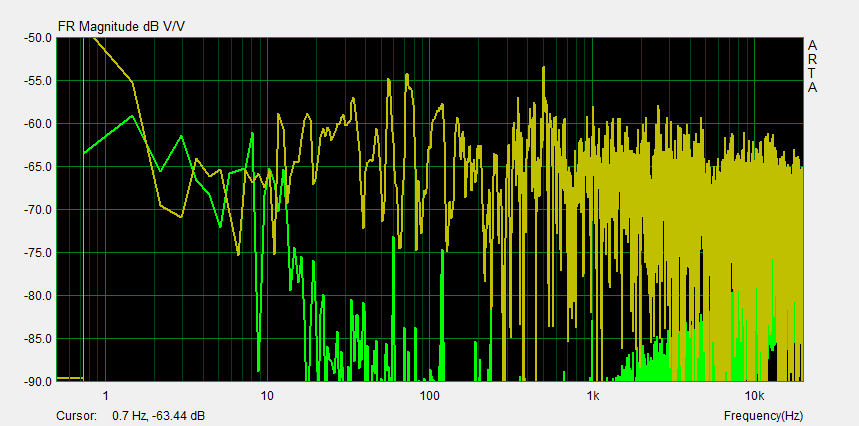
The -3 dB bandwidth BW = 2.2/T60 of a single mode would equal 2.2 Hz for T60 = 1 s. In order to resolve the modes in the frequency response of the L to A room transmission we might chose a 0.7 Hz resolution for the FFT of the impulse response, which requires a 1/0.7 Hz = 1.43 s portion of the impulse response. If data were taken at 48 kHz sampling rate, then the FFT should be 48 kHz x 1.43 s = 69k samples long or 64k as the closest standard operation.
The 64k DFT of the impulse response for L to A and R to A clearly shows the 0.7 Hz frequency steps and the rapid variation of signal amplitudes. The graphical presentation is such that a 20 dB change and a 1 decade frequency change form a square. A 6 dB/oct slope will then form a line at 45 degree angle. For comparison purposes it is desirable to standardize on 20 dB amplitude per frequency decade squares. Marketing people prefer 60 dB/dec or more, which gives a much smoother response and more impressive looking curve. Even some DIY designers follow this practice.
The same response could have been obtained by slowly
sweeping a sinewave source. The sweep rate would have to be slow enough for the
signal to reside inside the mode bandwidth longer than the rise time of the
mode, in order to reach the steady-state amplitude. For BW = 2.2 Hz and an
associated rise time of 330 ms and assuming that the sweep signal should stay
within that bandwidth for at least 500 ms, we require a sweep rate of 2.2/0.5 =
4.4 Hz/s.
A sine sweep from 20 Hz to 200 Hz would take 180/4.4 = 41 s and allows to
clearly hear the room modes. It is quite instructional but only loosely
correlated to what is heard with program material. (Toneburst
Test Signal CD)
A sweep from 20 Hz to 20 kHz would take 20000/4.4 = 4545 s = 76 (!) minutes. In
the days before computers and FFT algorithms loudspeakers were measured with
sine sweeps and chart recorders. Frequency resolution was usually traded off for
shorter sweep times and smoother looking curves. A faster alternative was a
parallel filter bank, real time analyzer with pink noise as the stimulus.
 |
The frequency response of ambient noise must also be measured. It usually sets the limit for how low in frequency one can trust the measured room response. In the example here the lower limit is about 20 Hz. Note that a signal of 10 dB lower amplitude causes an uncertainty in the range of +2.4 dB to -3.3 dB depending upon the phase between the two signals and to which degree the lower level signal adds or subtracts from the room response measurement.
 |
The room response must be averaged to recognize trends in the summation of direct and reflected signals at the microphone. The resulting curves must not be taken as a 1:1 representation of what is heard as loudness at different frequencies. The room response gives a picture of the steady state SPL, where sound generation and sound dissipation in the room have reached their equilibrium. The response is very dependent upon the microphone location because the interference between different sound streams changes with their relative phase, which is location dependent. Averaging smoothes the interference notches and peaks and typically 1/3rd octave smoothing is applied. Hearing integrates sounds in 1/3rd octave bands.
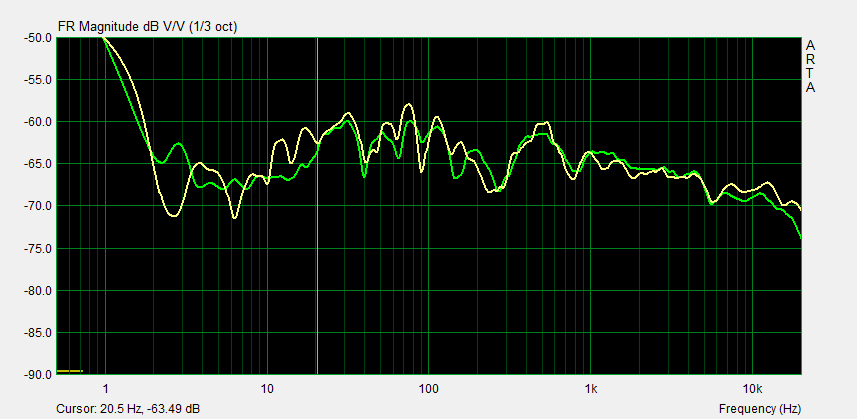 |
The brain operates both in frequency and time domains when interpreting the summation of sound streams at each ear drum. A floor reflection, which probably causes the dip at 250 Hz is a natural phenomenon that we have grown up with. The frequency of the notch has changed as we grew taller and I suppose that we interpret the delayed reflection versus the direct sound from a source as an indication of source height over the floor.
The room response is used as the basis for room equalization to an empirically derived target. I am highly skeptical of this practice. It should only be applied to one or two most dominant low frequency room modes. Our brain has evolved to deal with sound in reverberant environments and gets tired when having to compensate for unnatural processes from a DSP room equalizer. But, EQ can certainly make it sound different.
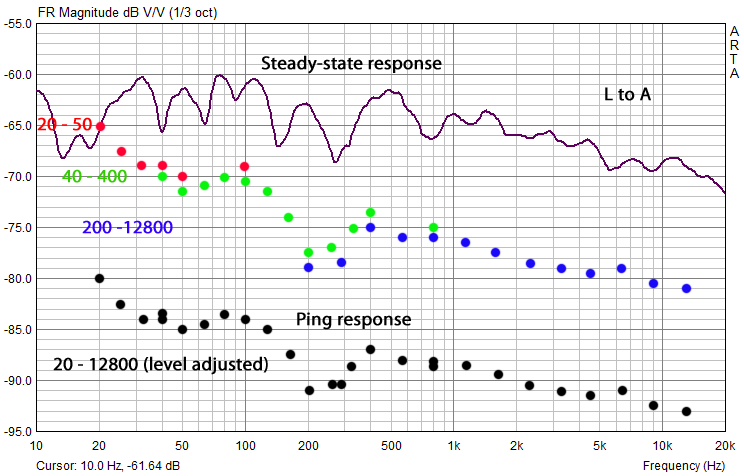
It takes time for sound pressure in a reverberant space to reach the equilibrium between supplied and dissipated energy that described by the steady-state response. Music and speech are time-varying signal streams consisting of transient and sustained tones of modulated strength interspersed with moments of silence. The impulse response of a room can be windowed and filtered to describe the short time behavior of the loudspeaker and room combination as, for example, with the Burst Decay test of ARTA. The following Ping Test is very similar and could be mathematically derived from the impulse response, but is not available as such. The objective here is to find the peak amplitude of the room response at specified frequencies for the prescribed ping signal and to compare the result to the steady-state room response. It has been my experience that the ping or initial room response correlates strongly to what is perceived when listening to program material. The ping response also gives a direct picture of the sound build-up due to reflections overlapping with the direct signal and decay of reflections.
 |
 |
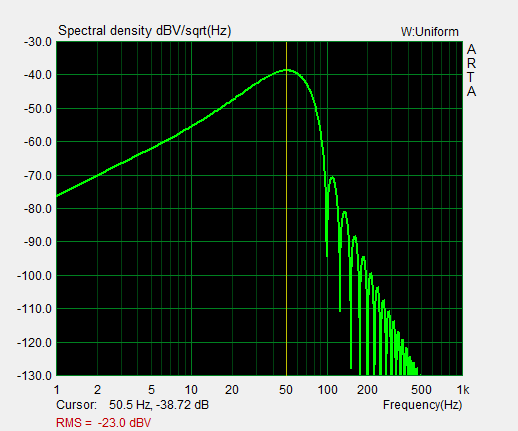 |
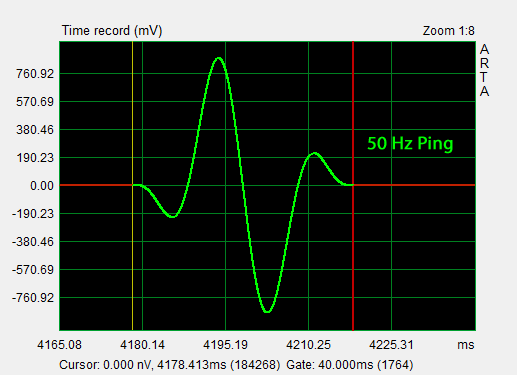
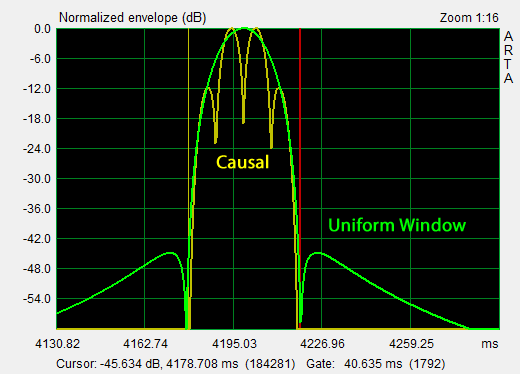
The test signal is essentially a single sinusoid with soft start and soft stop. It is generated from four sinewave cycles, which are modulated by a single cosine envelope in GoldWave:
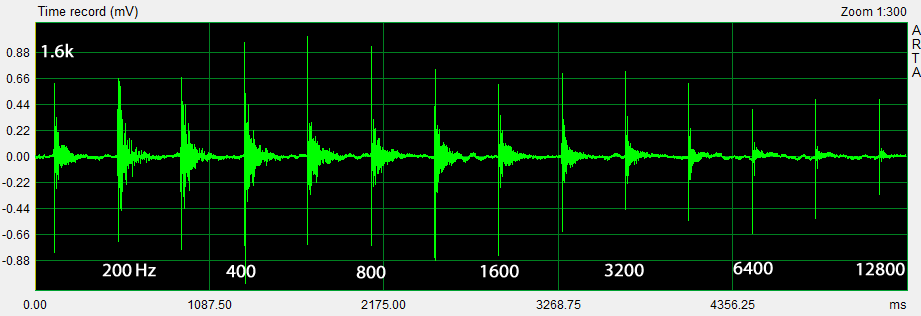
0.95*((0.5-0.5*cos(2*pi*t*f/x))*sin(2*pi*t*f))*(step(t)-step(t-(x/f))) The ETC or normalized envelope of the test signal spreads out in time below -45 dB because of the Uniform Window used in deriving it. The causal display corresponds to the full-wave rectified and logarithmically displayed test signal. For room response analysis I use the Uniform Window, which hides the four sinusoids and represents a single ping. The short duration of the ping requires many spectral components. The ping spectrum is wide and provides frequency overlap between 1/3rd octave steps of the ping frequency. The curve shape for a 100 Hz ping is the same as that for the 50 Hz ping, except shifted to 100 Hz and 3 dB lower in magnitude provided that both signals have identical amplitudes. The 100 Hz ping is shorter in duration and has 1/2 the energy. Three ping sequences are used to cover the 20 Hz to 12.8 kHz range within three 5.33 s time records of 256k samples, which is the maximum length for ARTA at 48 kHz sampling rate. |
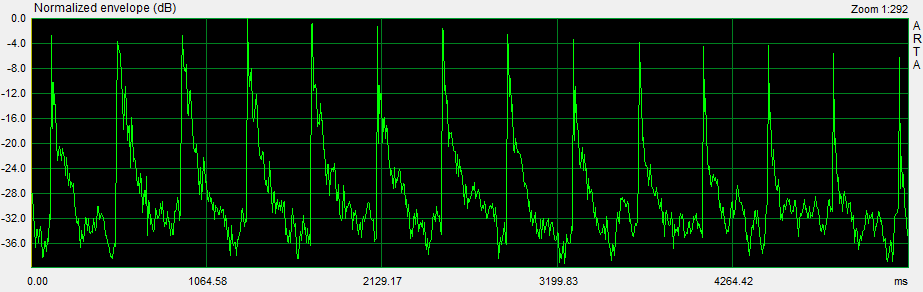
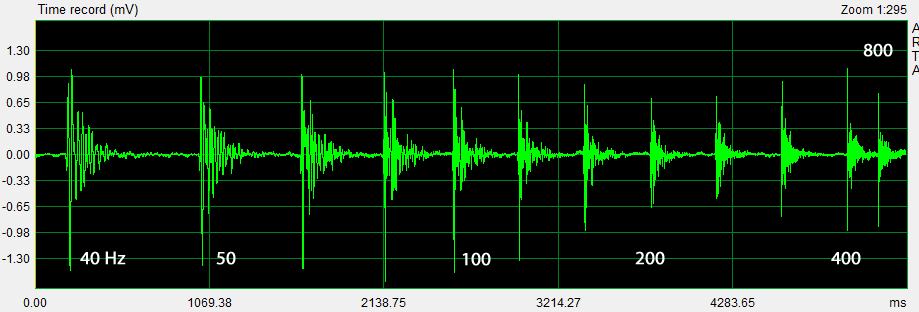
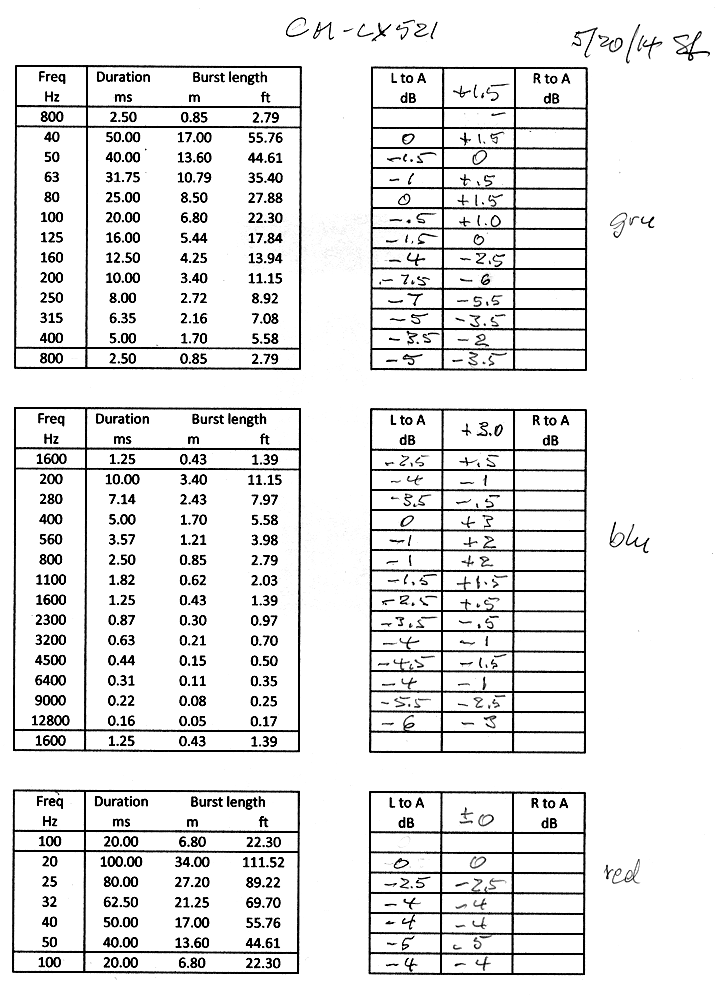
The first ping test sequence from 40 Hz to 400 Hz covers the modal frequency range below the Schroeder frequency and above in 1/3rd octave steps. The sequence starts at 40 Hz and requires a large volume displacement from the loudspeaker. Playback volume should be adjusted to a maximum just below the onset of audible distortion. The 800 Hz pings at the start and end of the sequence are used for triggering the record taking of ARTA. They also serve as reference when comparing the peak response from this sequence to a higher frequency ping sequence.
 |
The time record, for example, of the L to A ping transmission shows the peak amplitude variation of the pings vs. ping frequency and the decay of room reflections. The reason for the asymmetry of the lower frequency peak-to-peak excursions is not obvious and should be investigated if it is non-linear driver performance related and audible.
|
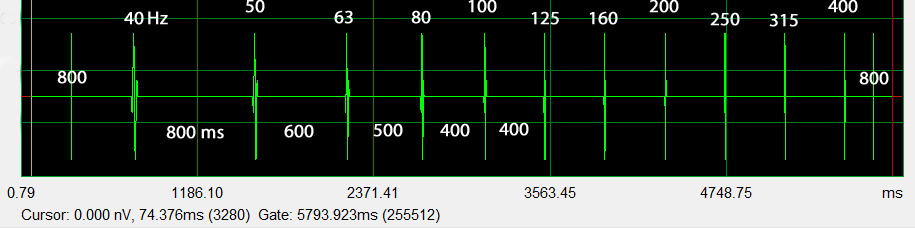
The ETC of the ping sequence shows the envelope of the ping response normalized to 0 dB for the highest amplitude ping, which is at 40 Hz in this example. The peak amplitude of each ping is be written down in order to compare it with the steady-state, 1/3rd octave smoothed frequency response of the L to A transmission. A response pattern for a set of early reflections is also visible.
The frequency range from 200 Hz to 12800 Hz is covered in thirteen 1/2 octave steps. The 200 Hz to 400 Hz octave overlaps with the previous sequence for matching absolute amplitude values of the two ping sequences from normalized readings.
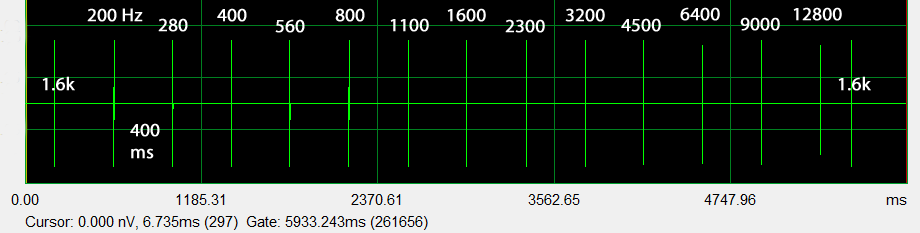 |
Again the peak amplitudes of the normalized envelope response are written down for comparison with the room response.
|
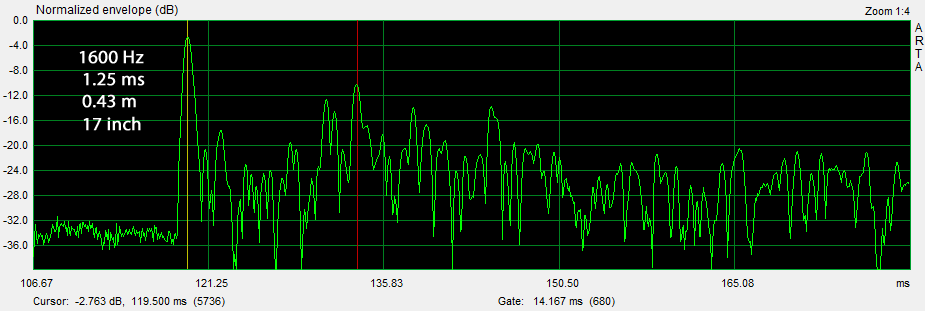
The envelope response can be expanded to see the decay of reflections and to estimate graphically the decay rate and RT60 at different ping frequencies. Time and spatial resolution increases with ping frequency. At 1600 Hz, for instance, the ping duration is 1.25 ms or 17 inch in length. Reflections with a path length that is longer than the distance from L to A by more than 17 inch will not overlap with the first arriving, direct ping and only with themselves. A 1600 Hz ping can be useful in identifying the surface or object that caused the reflection. Higher ping frequencies provide greater spatial resolution but the reflections a usually more attenuated. For the instance above the cluster of reflections around 14 ms after the direct signal should be investigated to understand its origin and possible contribution to what is heard.
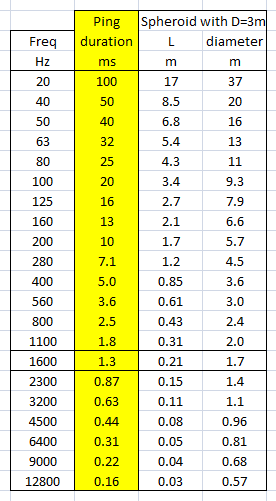 |
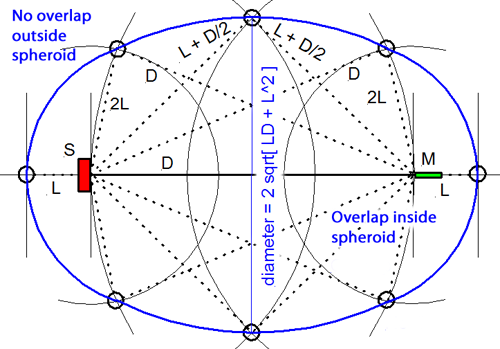
Reflection overlap with the direct ping response The boundary between an overlapping and not overlapping reflection is the surface of a spheroid with an axis of rotation of length a = D + 2L and a maximum diameter b = 2*sqrt(LD + L^2) where D is the distance between burst source S and microphone M. The minimum overlap free distance 2L applies to reflections from directly behind the source or directly behind the microphone. Reflections from objects inside the spheroid overlap the direct signal. The size of the spheroid increases with lower frequencies and longer burst durations. |
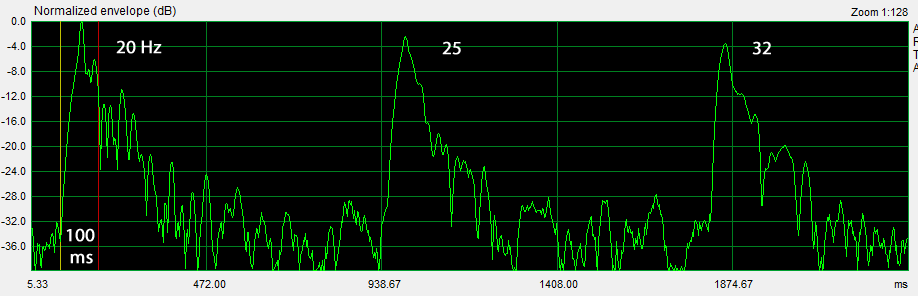
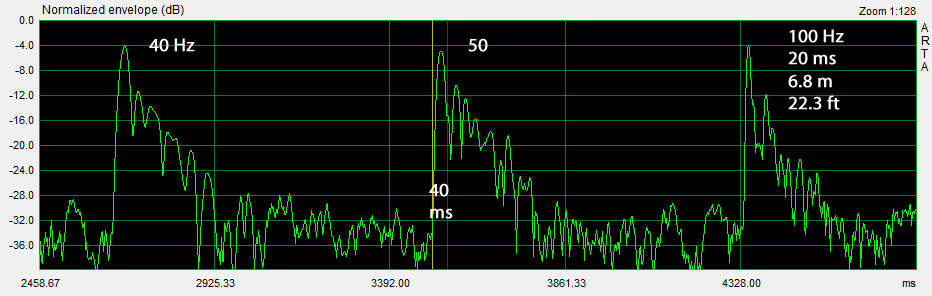
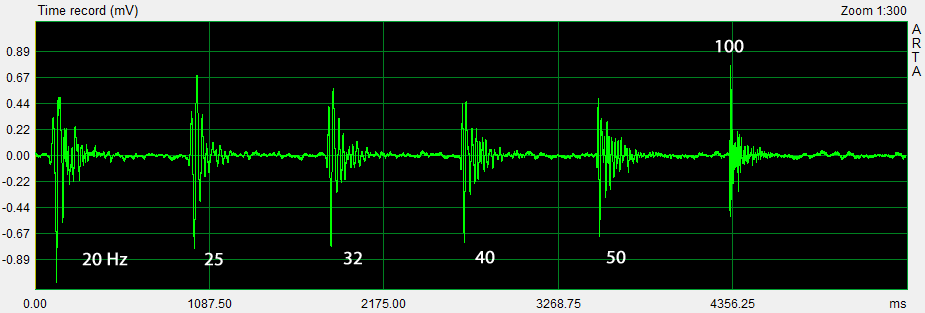
The ping response in the 20 Hz to 50 Hz frequency range is heavily influenced by the room. First reflections overlap the direct ping with little phase shift. The ping signal is also stressing the subwoofer, which is usually excursion limited at its lowest frequencies. Distortions are clearly audible and limit the maximum sound pressure level for the test. A ping is a safe, non-destructive test signal to explore the output limits of a loudspeaker if carefully used.
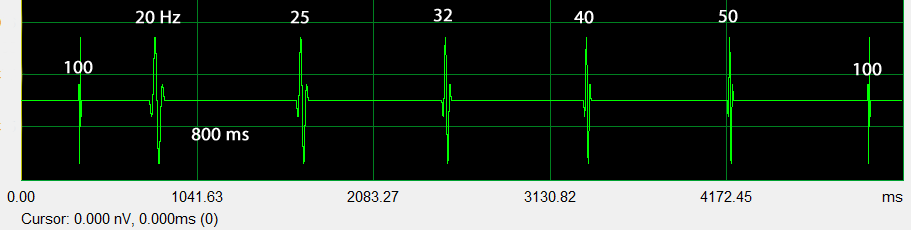 |
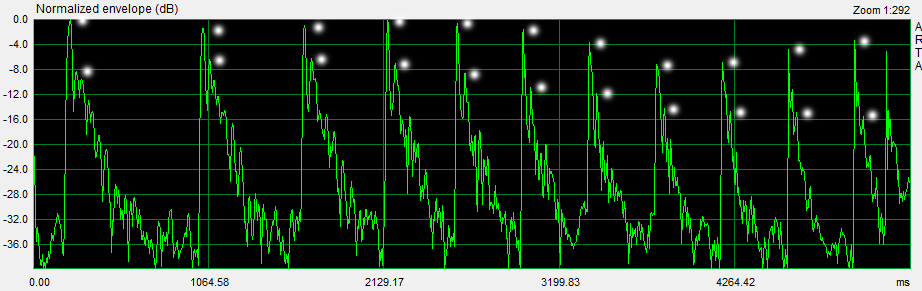
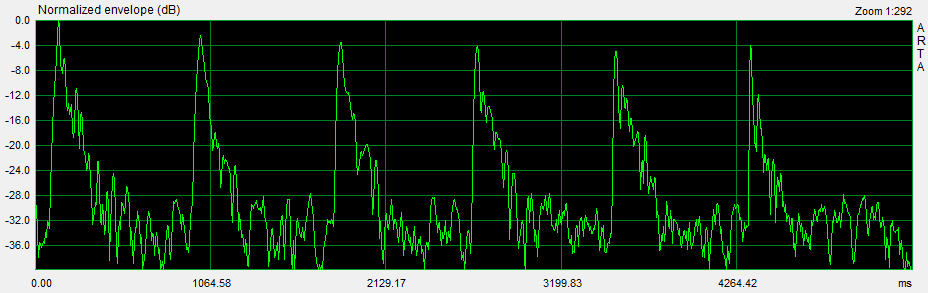
The time gap between the pings is increased to 800 ms to allow for full decay of the long duration pings and reflections before the next ping starts.
|
Expanding the envelope response by zooming 1:128 gives a clearer picture of each ping response. The 20 Hz ping shows large amounts of distortion as judged by predominantly higher frequency reflections of less than 100 ms width. Compare the decay to the 50 Hz and 100 Hz decay to recognize the short duration reflections of 20 Hz distortion products. A non-consistent change in pitch of the tone sequence is readily heard. The 20 Hz ping sounds too bright.
The peak amplitudes from the three sets of normalized envelope responses are recorded in a spreadsheet Ping-room-speaker.xls . They can then be added to a graph of the steady-state frequency response, which was computed from the impulse response of the L to A transmission. The peak values are normalized to the amplitude of the largest ping response in each set. This makes it possible to run each test set at a volume level that maximizes ping-to-ambient noise levels before distortion becomes audible. When the three sets are plotted there will be offsets between them. There is an overlap of peak data between the 20-50 Hz and 40-400 Hz sets, and the 40-400 Hz and 200-12800 Hz sets in order to align the peaks for a continuous sequence by removing the offsets.
 |
The ping response can be expected to be different from the steady-state response, especially towards low frequencies, where the overlap of reflections and direct ping adds differently to a peak than the phase sensitive interference between continuous sinewaves in the steady state response, which has been 1/3rd octave smoothed.
The test and measurement methodology described here will be used to gather data for different combinations of loudspeakers, rooms and listening locations. Hopefully patterns emerge that can be correlated to listening experiences. Hopefully this provides guidance for optimizing a particular room and loudspeaker configuration. (Case studies)
+++++++++++++++++++++++++++++++++++++++++++++++++++++++++++++++++++++++++++
|
| ||||