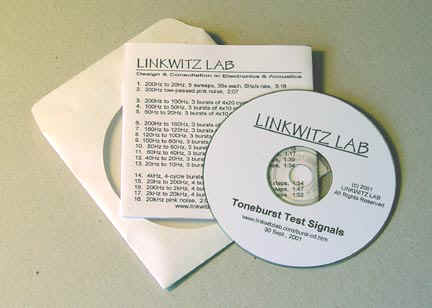
----- Experience in your own room the magical nature of stereo sound -----


What's new


LX - Store


BLACKLIST


Conversations
with Fitz


OPLUG
Forum


Basics

The Magic in 2-Channel Sound

Issues in speaker
design

Dipole models

Active filters

Amplifiers etc

Microphone

FAQ's

Loudspeakers

Crossovers

Room acoustics

Stereo Recording and Rendering

Audio production

Conclusions


Projects

Your own desig

LXmini

LXmini+2

LXstudio

LX521.4

LX521
reference

ORION
challenge

ORION-3.4

PLUTO-2.1

WATSON-SEL

PLUTO+
subwoofer

THOR
subwoofer

PHOENIX
dipole speaker

Three-Box active
system (1978)

Reference
earphones

Surround
sound

Loudspeaker
& Room


Resources

Publications

Sound recordings

Links

Other designs

My current setup

About me

Site map


HOME


------------------
Digital Photo
Processes


------------------
The
Sea Ranch


------------------
My Daughter
the Jeweler


What's new


LX - Store


Conversations
with Fitz


OPLUG
Forum


Sound recordings

--- Sound Picures CD --- Toneburst CD --- Internet Radio & CD Collections --- 


Toneburst Test Signal CD

The audio signals on the CD allow you to test and evaluate the behavior of your listening room in response to your loudspeakers.  At frequencies below 200 Hz the tests rely on listening and lead to the detection of room mode (resonance, standing wave) frequencies and their effect upon the reproduction of fluctuations in the low frequency multi-burst test signal

Room reflections are best evaluated by using a storage oscilloscope to display the time response to a short duration toneburst.
The response to short tonebursts from 20 Hz to 20 kHz can be measured with a fast, peak holding SPL meter, if available, or a storage oscilloscope. The Radio Shack sound level meters are too slow for the high frequency bursts and at low frequencies their response is rolled off. Accurate single burst measurements require instruments like the NTI Acoustilyzer.

For other tests using the toneburst signals see the more detailed description of the CD track contents below.
All signals are recorded equally in left and right channels. A voice announcements of signal type and of each upcoming burst frequency is added to the left channel. 

1. 200Hz to 20Hz, 5 sweeps, 36s each, 5Hz/s rate, 3:18
2. 200Hz low-passed pink noise, 2:07

3. 200Hz to 100Hz, 3 bursts of 4x 20-cycles, large steps, 0:55
4. 100Hz to 50Hz, 3 bursts of 4x 10-cycles, large steps, 0:54
5. 50Hz to 20Hz, 3 bursts of 4x 10-cycles, large steps, 1:09

6. 200Hz to 160Hz, 3 bursts of 4x 20-cycles, 4Hz steps, 1:27
7. 160Hz to 120Hz, 3 bursts of 4x 20-cycles, 4Hz steps, 1:31
8. 120Hz to 100Hz, 3 bursts of 4x 10-cycles, 2Hz steps, 1:15
9. 100Hz to 80Hz, 3 bursts of 4x 10-cycles, 2Hz steps, 1:13
10. 80Hz to 60Hz, 3 bursts of 4x 10-cycles, 2Hz steps, 1:15
11. 60Hz to 40Hz, 3 bursts of 4x 10-cycles, 2Hz steps, 1:17
12. 40Hz to 20Hz, 3 bursts of 4x 10-cycles, 2Hz steps, 1:39
13. 20Hz to 10Hz, 3 bursts of 4x 10-cycles, 2Hz steps, 1:34

14. 4kHz, 4-cycle bursts at 100ms intervals, 3:09
15. 20Hz to 200Hz, 4 bursts of 4-cycles, 1/3rd oct steps, 1:54
16. 200Hz to 2kHz, 4 bursts of 4-cycles, 1/3rd oct steps, 1:47
17. 2kHz to 20kHz, 4 bursts of 4-cycles, 1/3rd oct steps, 1:52

18. 20kHz pink noise, 2:07
19-28. 12.8 kHz to 25 Hz in oct steps, five 5-cycle bursts each oct


Ordering and payment information

These 28 files are available as download and to play from your computer's memory or to burn to CD-R. But CD-R degenerate over time and become useless.

To order the files choose from plans, CDs downloads.


How to use the different sound tracks

The sound tracks on the CD are primarily for an analysis of loudspeaker and room. The solution to any problems discovered could cover a wide range of options and is left up to your resourcefulness. It will rarely be a case of moving the speakers just a few inches. Please do not ask me for free advice, but study the Room Acoustics pages.  
Listen to the audio tracks from your "sweet spot", but also from other places in your room. Move your head to note how quickly or how slowly a phenomenon changes with position. Check what you find against any theories and claims you have subscribed to. Direct experience is the ultimate arbiter. The acoustic behavior of real rooms is exceedingly difficult to predict.
The first 13 audio tracks are limited to frequencies below 200 Hz, because this is the range of discrete modes in typical size domestic listening rooms. The upper limit of this range is given by the Schroeder frequency.

Track 1
A constant amplitude sine wave that is slowly swept from 200 Hz to 20 Hz at a rate of 5 Hz/s. This rate is slow enough so that a typical room resonance can build to nearly full amplitude. 

For example, a single resonance with a 60 dB decay time T60 of 500 ms will have a rise time of 
Trise = 0.32 T60 = 160 ms. 
During that time the swept frequency will have changed by 
(0.16 s) x (5 Hz/s) = 0.8 Hz,
which is small in absolute terms and also small when compared to the -3 dB bandwidth of the resonance.
BW = 2.2 / T60 = 4.4 Hz

You will be able to hear the dominant resonances of your room during the sweep and be able to determine their approximate frequency by measuring the time from start of the sweep with a stop watch. For example, if a noticeable peak in volume occurred 18 s after the start, then the frequency would be 200 Hz - (18 s) x (5 Hz/s) = 110 Hz.  
You will probably also notice various buzzes and rattles at different frequencies caused by objects in your listening room, or possibly by your speaker itself. As the sweep approaches its low frequency end you may have to reduce the volume level to avoid bottoming and possibly damaging the woofer. Be careful with this test. Start out at low volume levels. Every speaker is eventually limited by its cone excursion capability.

As an informative experiment download and play a 200 Hz to 20 Hz sweep from Track 1 to test your loudspeaker and room combination for boom and rattle.   200-20Hz_sweep.wav 
Start out at low volume level to avoid damage of the woofer from extreme cone displacements. Use an elapsed time measurement to determine the worst room resonance frequencies. A Real Time Analyzer (e.g. AudioTools application for iPhone) is convenient to show approximate frequency and and amplitude values. The amplitude can vary widely between different locations in the room.

Track 2
Pink noise that is limited to frequencies below 200 Hz. The signal changes randomly in amplitude and frequency. The magnitude of its spectrum envelope decreases at 3 dB/octave (10 dB/dec) towards high frequencies. The noise waveform, below, clearly shows a maximum rate of change of around 200 Hz, when you visually compare it to a 200 Hz sine wave. 

Listening to the signal gives an averaged impression of room/speaker response. Room modes cannot build up to full strength, because frequency and amplitude of excitation are continuously changing at random. Real signals of interest, like music, are much more periodic. So this signal is the extreme opposite to the swept sine wave. But, rarely is music as static as a constant amplitude sine wave, which is another extreme case. Live sounds fall between the two test stimuli and are somewhat closer to the sine wave.

Tracks 3 - 5
Multi-burst signals consisting of four consecutive 10-cycle or 20-cycle bursts with cosine envelope as in the top trace of the graph below. This is identical to four modulation rate cycles of a 100% amplitude modulated sine wave. The modulation rate is 1/10th or 1/20th of the carrier frequency. Each multi-burst signal is repeated three times.

Track 3 provides 20-cycle bursts at 200, 180, 160, 140, 120, 110, 100 Hz.
Track 4 provides 10 cycle bursts at 100, 90, 80, 70, 60, 55, 50 Hz.
Track 5 provides 10 cycle bursts at 50, 45, 40, 35, 30, 25, 20 Hz.

Listen for the amplitude fluctuation in each multi-burst signal as its frequency changes. The degree of articulation changes depending on the burst's proximity to room mode frequencies and from where you listen in the room. The sound may drone  without any articulation, as in the bottom trace of the graph above, or even seem to fluctuate at a higher rate when multiple modes interfere with each other. The goal is to hear consistent articulation from the normal listening place. In that case you can expect to hear musical sounds with high resolution and without muddying.
For more background on these and other room response tests see Ref.1 in Publications.

The frequency steps between bursts are relatively wide and these tracks are intended for a coarse investigation or for highly damped room which have a wide bandwidth for each mode.

Tracks 6 - 13
Multi-burst signals consisting of four consecutive 10-cycle or 20-cycle bursts with cosine envelope. This is identical to four modulation rate cycles of a 100% amplitude modulated sine wave. The modulation rate is 1/10th or 1/20th of the carrier frequency. Each multi-burst signal is repeated three times.

Track 6 provides 20-cycle bursts at 4 Hz frequency steps from 200 Hz - 160 Hz.
Track 7 provides 20-cycle bursts at 4 Hz frequency steps from 160 Hz - 120 Hz.
Track 8 provides 10-cycle bursts at 2 Hz frequency steps from 120 Hz - 100 Hz.
Track 9 provides 10-cycle bursts at 2 Hz frequency steps from 100 Hz - 80 Hz.
Track 10 provides 10-cycle bursts at 2 Hz frequency steps from 80 Hz - 60 Hz.
Track 11 provides 10-cycle bursts at 2 Hz frequency steps from 60 Hz - 40 Hz.
Track 12 provides 10-cycle bursts at 2 Hz frequency steps from 40 Hz - 20 Hz.
Track 13 provides 10-cycle bursts at 2 Hz frequency steps from 20 Hz - 10 Hz.

The different tracks allow a high frequency resolution analysis of mode behavior, as described for tracks 3-5. Specific mode frequencies that were found with track 1 can be further investigated, but other frequencies should be listened to as well, because the stimulus signal is different. Special care must be taken with  tracks 12-13 not to damage the woofer by excessive cone excursions. There is no danger of thermal damage, because the burst signal duration is short and of low duty cycle.

Track 14
A 4-cycle toneburst of 4 kHz frequency with Blackman envelope. It is repeated at 100 ms intervals, which is a 10 Hz rate.


The signal is used to determine the presence and delay in arrival time of room reflections. It requires the use of an oscilloscope, preferably with digital storage. I am not aware of a test signal that allows for audible discrimination between direct and reflected sound. The path length difference between direct and reflected sound can be determined from the speed of sound, 343 m/s = 34.3 cm/ms or about 1 ft/ms, and the time differences measured with the oscilloscope. It becomes then a matter of finding in your room where the reflection occurs and whether it can be attenuated or diffused. 

The short duration test burst allows about 20 cm resolution of distance. The signal is most likely radiated from the tweeter in your loudspeaker. Being of short duration and low duty cycle you can safely increase its level until you hear the beginning of a change in sound character, which indicates clipping of either the power amplifier or the tweeter. Reduce the level until you are in the linear operating range again.

Tracks 15 - 17
A 4-cycle toneburst with Blackman envelope that is repeated four times at each frequency. The burst covers a spectrum of about 1/3rd octave around its frequency. The Blackman time envelope was chosen for better attenuation of the spectral envelope at low and high frequencies than obtainable with a cosine time window. The burst frequencies are at approximately 1/3rd octave steps.

Track 15 - Four single bursts at 20, 24, 32, 40, 52, 64, 80, 100, 128, 160, 200 Hz.
Track 16 - Four single bursts at 200, 240, 320, 400, 520, 640, 800, 1000, 1280, 1600, 2000 Hz.
Track 17 - Four single bursts at 2, 2.4, 3.2, 4, 5.2, 6.4, 8, 10, 12.8, 16, 20 kHz.

In combination with a microphone and oscilloscope, a fast, peak holding SPL meter or custom peak detector, these test signals can be used to determine a meaningful in-room response of your speaker that correlates well with perception. The Radio Shack SPL meters are not suitable, because they respond too slowly. 
By observing the envelope decay of the burst on an oscilloscope you can see resonant decays that may be hidden in steady-state frequency response measurement curves. For more details see Ref.13 in Publications.
These are also safe test signals to determine the maximum SPL levels that can be obtained from a given power amplifier and/or loudspeaker at different frequencies. The onset of distortion is clearly audible. Little heat is generated in the voice coil, because the bursts have short duration.

Track 18
Full bandwidth pink noise. The signal changes randomly in amplitude and frequency. The magnitude of its spectrum envelope decreases at 3 dB/octave (10 dB/dec) towards high frequencies.

The signal is intended for listening tests. Since it is a dual mono sound you should listen for a stable center image from your stereo speaker setup. Move away from the "sweet spot" to hear how well the image holds up.
Move around in your room to hear changes in spectral balance due to the directivity of your speakers. Move up and down.
Check the integration of drivers and seamless transition between their frequency ranges by turning one ear to the speaker and moving up and down while about 1 ft away from the front panel.
Compare left and right speakers by switching the noise between left and right channels. The speakers must be placed right next to each other to avoid influence of the room on the comparison.
Compare different speakers and listen for differences in tonal coloration.

With a little practice and experience pink noise can become a very revealing test signal.

Tracks 19-28
These tracks are useful for testing the onset of clipping in an audio system. Each track contains five cosine-envelope or Hanning windowed bursts which were recorded at full scale. The bursts are repeated at 1 s intervals from 12.8 kHz to 800 Hz and at 2 s intervals from 400 Hz to 25 Hz. Listen for the burst becoming distorted as the volume level is increased. This indicates clipping in the electronics or a loudspeaker driver. It is a safe test when you increase the volume level gradually until you hear distortion and then reduce the level immediately.
You can also use these tracks to listen for room reflections.

Track 19    12.8 kHz, 5 bursts, 1 s interval
Track 20    6.4 kHz
Track 21    3.2 kHz
Track 22    1.6 kHz
Track 23    800 Hz
Track 24    400 Hz, 5 bursts, 2 s interval
Track 25    200 Hz
Track 26    100 Hz
Track 27    50 Hz
Track 28    25 Hz

The tracks were generated by using the Expression Evaluator f(x) in the GoldWave Digital Audio Editor. The 5-cycle burst is one envelope period of an amplitude modulated sinewave of frequency f. It is described by the expression:

(0.5-0.5*cos(2*pi*f*t/5))*sin(2*pi*f*t)

One period was copied for each of the ten frequencies f from 25 Hz to 12.8 kHz, and then pasted 5 times into a New Sound file which had 5 s or 10 s length. 

In a similar way you could generate most of the test waveforms for the other tracks described above. For example, the expression for a 4-cycle burst with Blackman envelope is:

(0.42-0.5*cos(2*pi*f*t/4)+0.08*cos(4*pi*f*t/4))*sin(2*pi*f*t)


See also:

1 - Siegfried Linkwitz, Investigation of Sound Quality Differences between Monopolar and Dipolar Woofers in Small Rooms, 105th AES Convention, San Francisco, 1998, Preprint 4786, Abstract, Manuscript

---------------------------------------------------------------------------------------


Pink Noise Imaging Tests

Pink noise is a test signal for which the evolutionary brain has no natural equivalent. It is not clear what it is supposed to sound like. The closest might be the breaking ocean surf. Pink noise is very useful for pointing out differences between left and right speakers due to room setup or component variations. It can be very difficult, though, to track down the cause of the sonic differences. Two different pairs of loudspeakers will almost certainly sound different, but that does not translate proportionally  to program material. It depends highly on the spectral content of the program material. 

A stereo system should be able to create a solid center phantom image on mono pink noise and produce pitch changes due to comb filtering with lateral head movement. These pitch changes do not occur on program material of familiar sounds since the brain filters them out. Stereo pink noise should be smoothly diffuse and not change timbre when listening from different places in the room. I have generated a one minute test track that alternates between mono and stereo pink noise in 5 second intervals. You can check the center image for different room locations and setups. I added three 3 kHz and three 300 Hz ten-cycle shaped bursts at the end of the track to check the center image location and definition for click-like signals at those frequencies. The 3 kHz test result is very room reflection dependent.

Download and save pink-alternating3.wav (12 MB). Then burn the 1 minute sound file to a CD-R for convenient access and repeated play.

1    Stereo = L & R 8    Mono
2    Left = L 9    Stereo
3    Right = R 10    Left
4    Mono = L = R 11    Right
5    Stereo 12    Mono
6    Mono 13    3 Bursts, 10 cycles @ 3 kHz, -3 dB FS
7    Stereo 14    3 Bursts, 10 cycles @ 300 Hz, -3 dB FS

 See also the Accurate Stereo page.


----------------------------------------------------------------------------------


Toneburst Imaging Test

A rapid sequence of 22 tonebursts from 12.8 kHz down to 100 Hz can be used to check the spatial stability and focus of the stereo center image as a function of frequency. Each burst consists of 4-cycles of a sinewave with a raised cosine envelope. The sinewaves are at 1/3rd octave frequency intervals. The bursts are separated in time by 50 ms and room reflections can affect the phantom image location. The sequences are repeated 8-times going down and up in frequency. 

The burst sweep can also be used to check for the onset of signal clipping as the playback volume is cautiously increased. The peak amplitude of each burst is constant at 0.9 FS.

Download and save 12_8k-100Hz-_4cycle_sweep_spaced_50ms_8x.wav (2 MB). Then burn the 12 second sound file to a CD-R for convenient access and repeated play.


----------------------------------------------------------------------------------


What you hear is not the air pressure variation in itself 
but what has drawn your attention
in the streams of superimposed air pressure variations 
at your eardrums

An acoustic event has dimensions of Time, Tone, Loudness and Space
Have they been recorded and rendered sensibly?

___________________________________________________________
Last revised: 02/15/2023   -  © 1999-2019 LINKWITZ LAB, All Rights Reserved